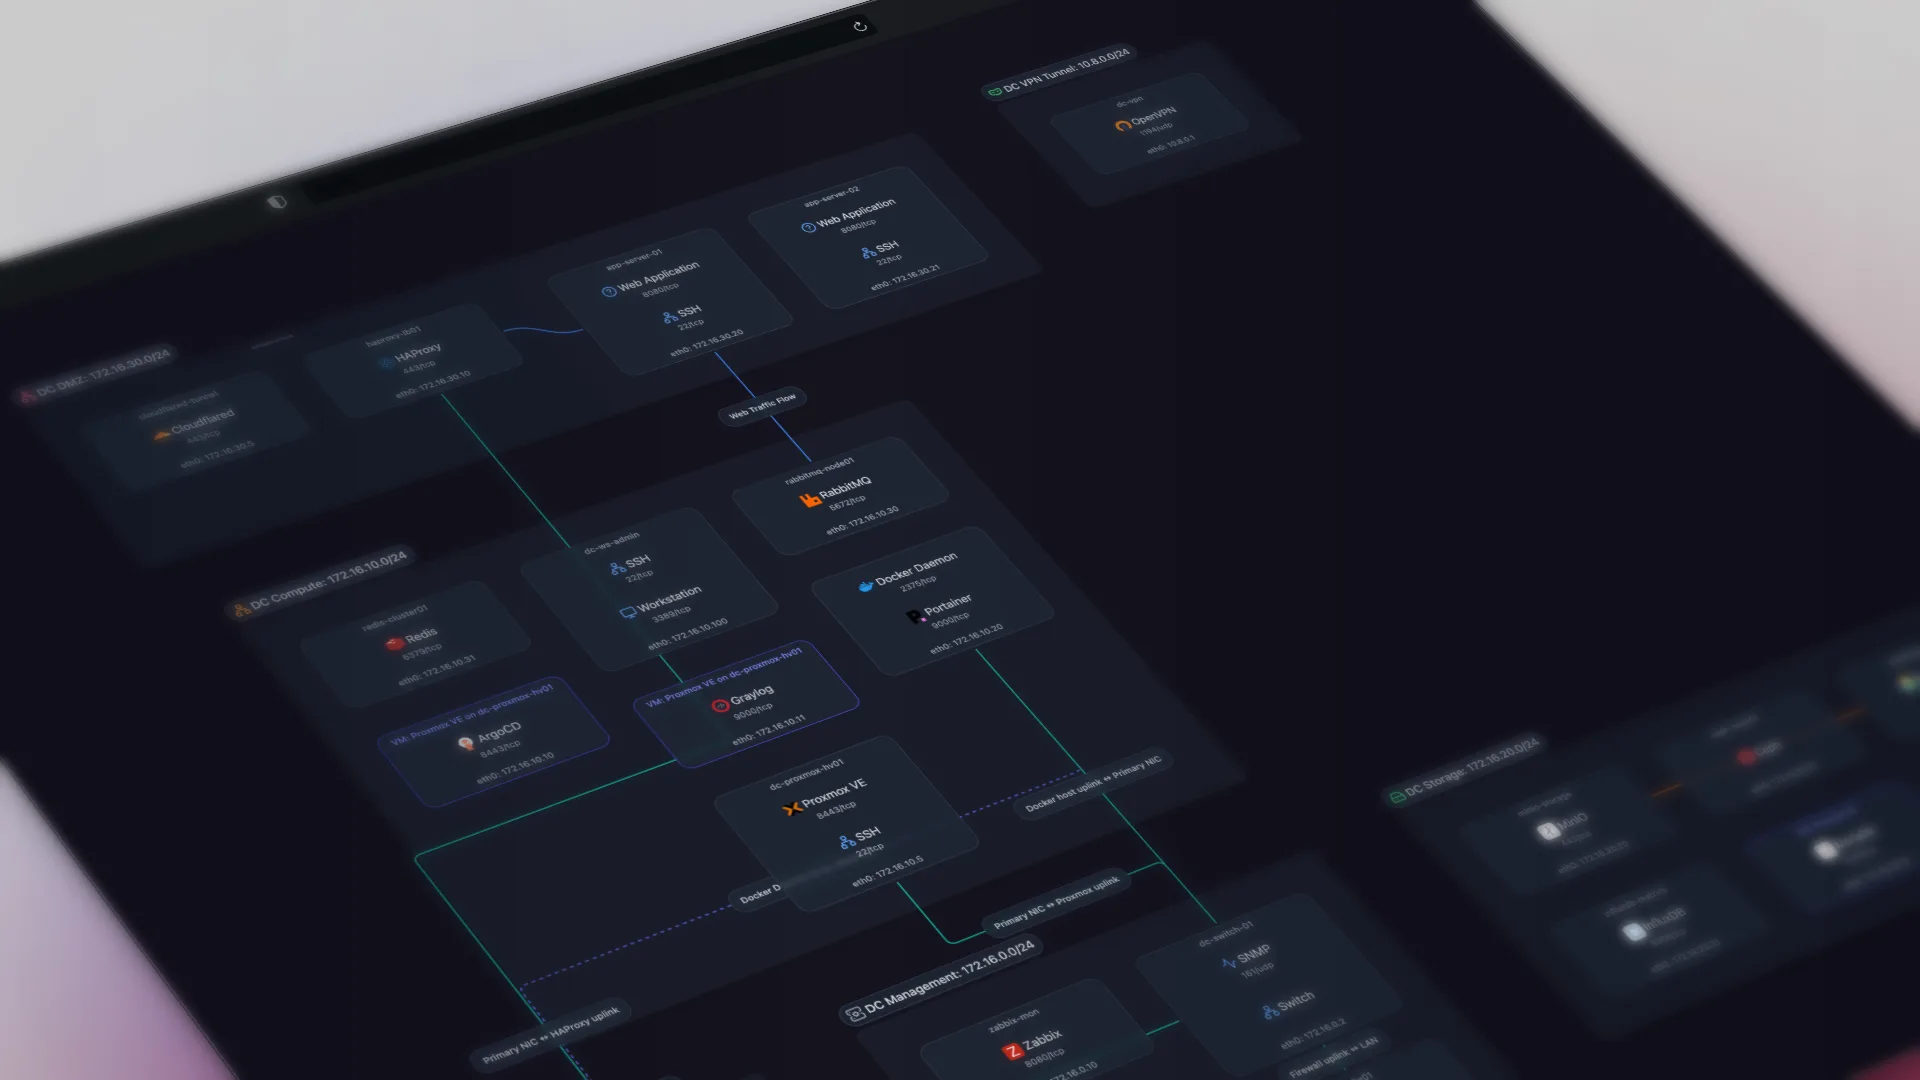
Observium is for teams that want autodiscovering SNMP monitoring across mixed vendors and can treat mapping as a per-device view. PRTG Network Monitor is for teams already running Paessler for monitoring who want status dashboards alongside their sensor data. The table below sets them side by side on the protocols each uses to discover a network, the topology views each produces, licensing, and pricing.
Observium and PRTG Network Monitor compared
Discovery protocols, the topology views each tool produces, service detection, pricing and licensing. Scanopy is in the table as a third option, and it is our product.
| ToolProduct name and link to vendor site | DiscoveryProtocols used to find devices and map connections | Network ViewsWhich topology views the tool produces from discovery. L2 Physical switch ports and links L3 Subnets, VLANs, routing Workload VM/container host nesting Application Service-dependency / app grouping Yes supported Tag ? unverified Greyed not supported | ServicesNo No service awareness Basic Common port detection Yes Application-level fingerprinting | PricingStarting price or pricing model | Open SourceOSI OSI-approved open source license Source available Source code available, restricted license No Proprietary |
|---|---|---|---|---|---|
| Observium | SNMP CDP LLDP [50] | No | Free (Community); Professional subscription [51] | OSI QPL | |
| PRTG | SNMP WMI ICMP [13] | No | Free to 100 sensors, then $200-$1,642/mo [4] | No | |
| Scanopy | SNMP LLDP CDP ARP ICMP mDNS TCP/UDP | Yes260+ types | Starts at $79.99 monthly, unlimited hosts | OSI AGPL-3.0 |
Scanopy is our product. Vendor details are sourced from official documentation, published pricing, and community reports as of June 2026. Features, pricing, and capabilities may have changed since publication. Check each vendor's website for the latest information.
Where each fits
Observium. Teams already committed to SNMP polling across a mixed-vendor estate who want device health, interface graphs, and neighbour data in one place, with Linux administration in-house.
PRTG Network Monitor. If you already run PRTG for monitoring and want a status dashboard on a floor plan, a network operations center view, or a top-10 sensor list, the Maps feature covers it without adding a tool. The device and sensor inventory behind it is thorough.
Head-to-head against Scanopy: Scanopy vs Observium and Scanopy vs PRTG Network Monitor. Looking more broadly: Observium alternatives,PRTG Network Monitor alternatives. For every tool side by side, see the full network diagram tools comparison.
Sources
[13] Paessler - PRTG System Requirements
[18] Scanopy - Documentation
[32] Paessler - PRTG has no native Layer 2 topology mapping (use UVexplorer)
[45] Paessler - PRTG Maps are customizable dashboards (manual)
[46] Paessler - PRTG UVexplorer listed as a separate product
[50] Observium - Autodiscovery via CDP, LLDP, FDP, EDP and OSPF neighbours
[51] Observium - Subscribe: Community vs Professional editions
Started as a homelabber, now deep in SNMP MIBs, Layer 3 topology, and service fingerprinting - building the network documentation tool I wished existed.