A network diagram that redraws itself after every scan.
Scanopy draws the physical topology port to port from LLDP, CDP, and switch forwarding tables, and the logical topology subnet by subnet. Each scheduled scan rebuilds both from what it finds.
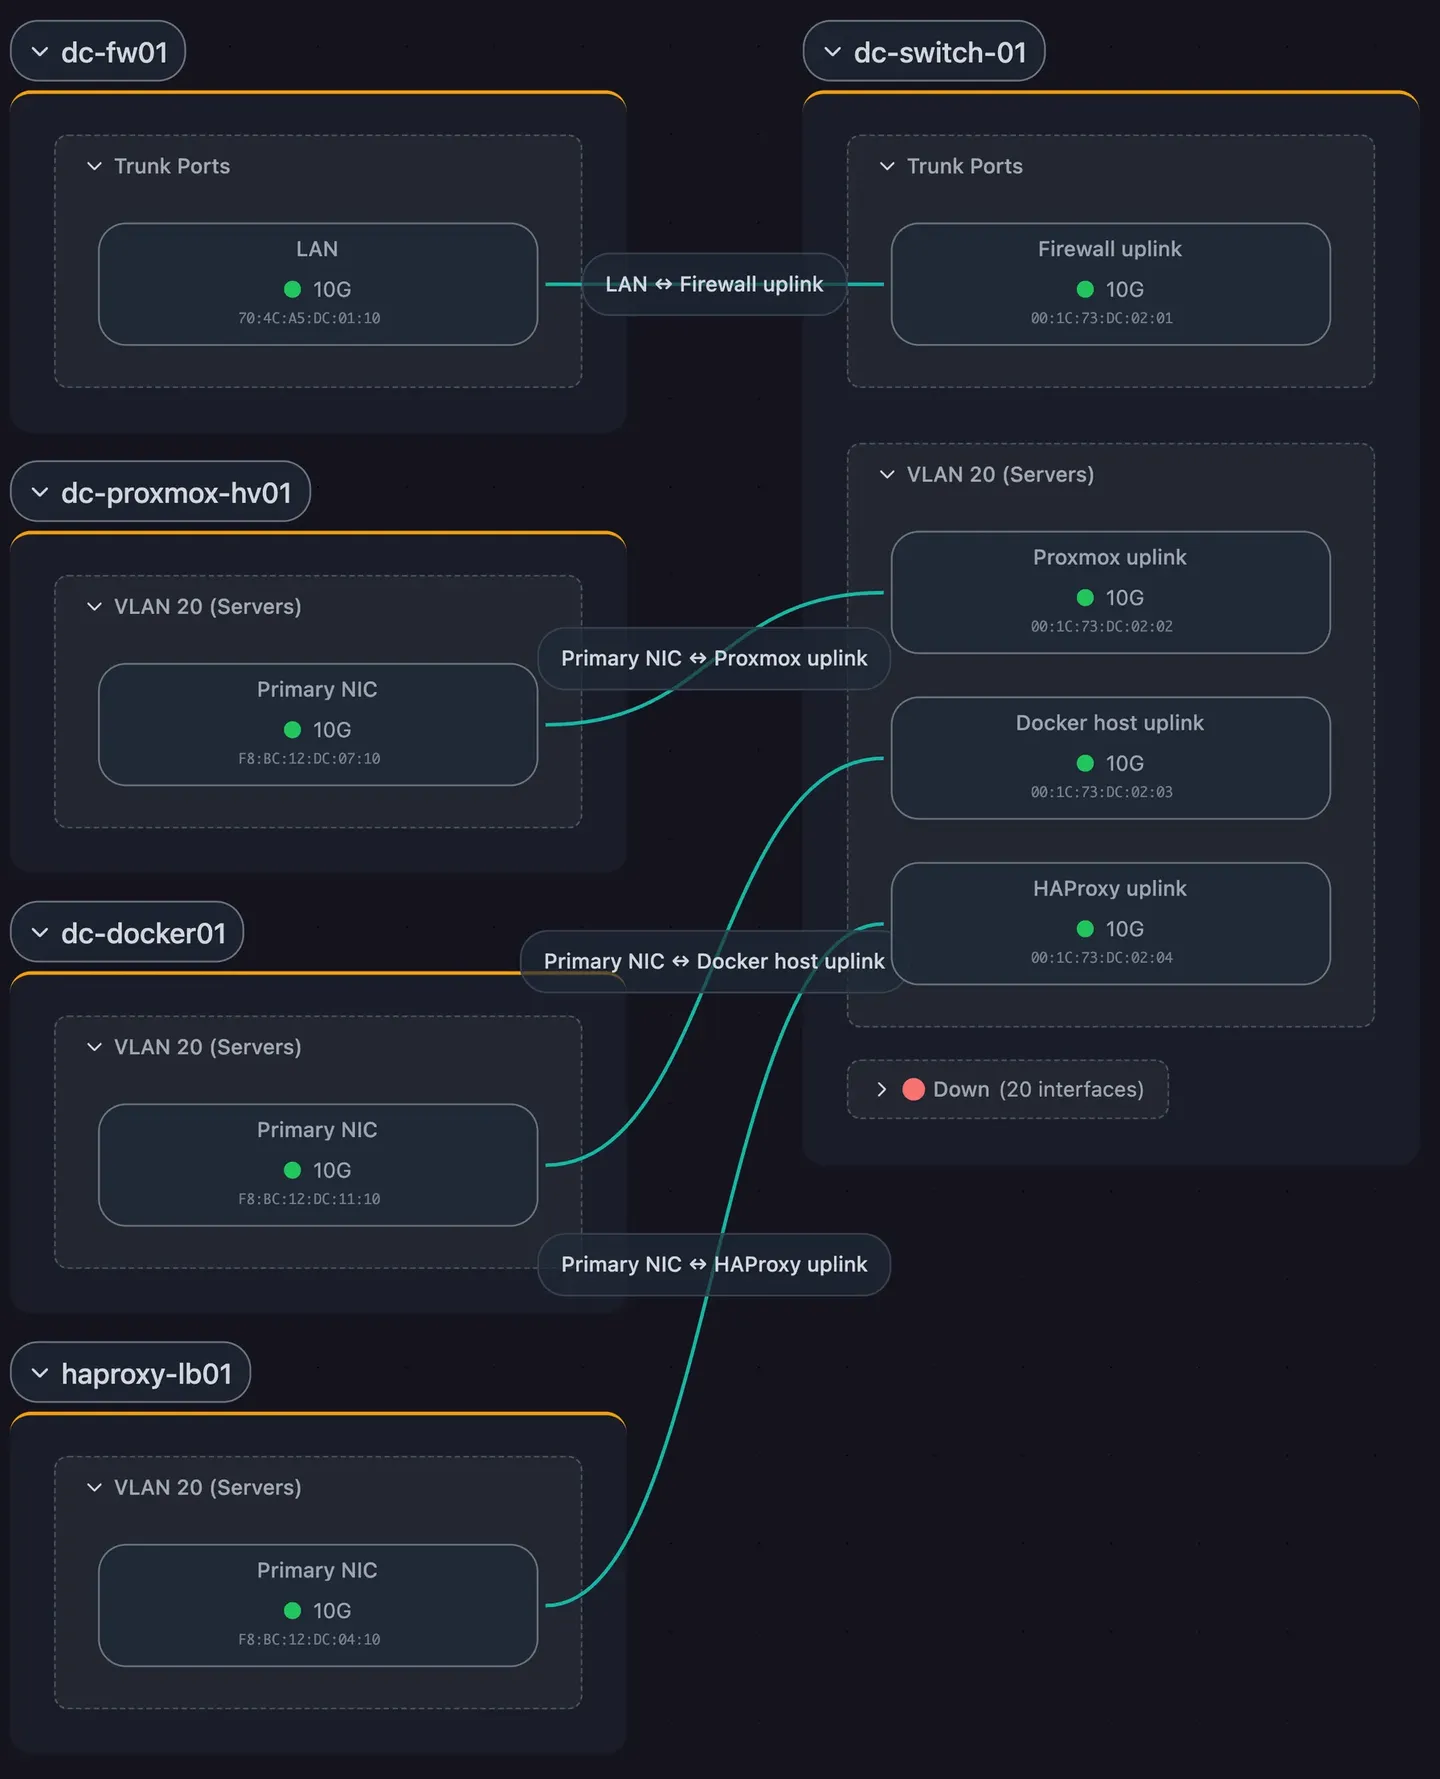
Physical (L2): every switch port and what plugs into it
Links from LLDP and CDP
Port-to-port links come from the neighbor tables on your switches, read over SNMP or gNMI, or from UniFi and HPE Aruba Instant On controllers.
Forwarding tables fill the gaps
Where a port has no LLDP neighbor but its forwarding table shows one device, Scanopy links the port to that device.
Port status and speed
Each port shows its speed and operational status. Trunk ports, access ports by VLAN, and ports by status are grouped by default.
Logical (L3): every subnet and the addresses in it
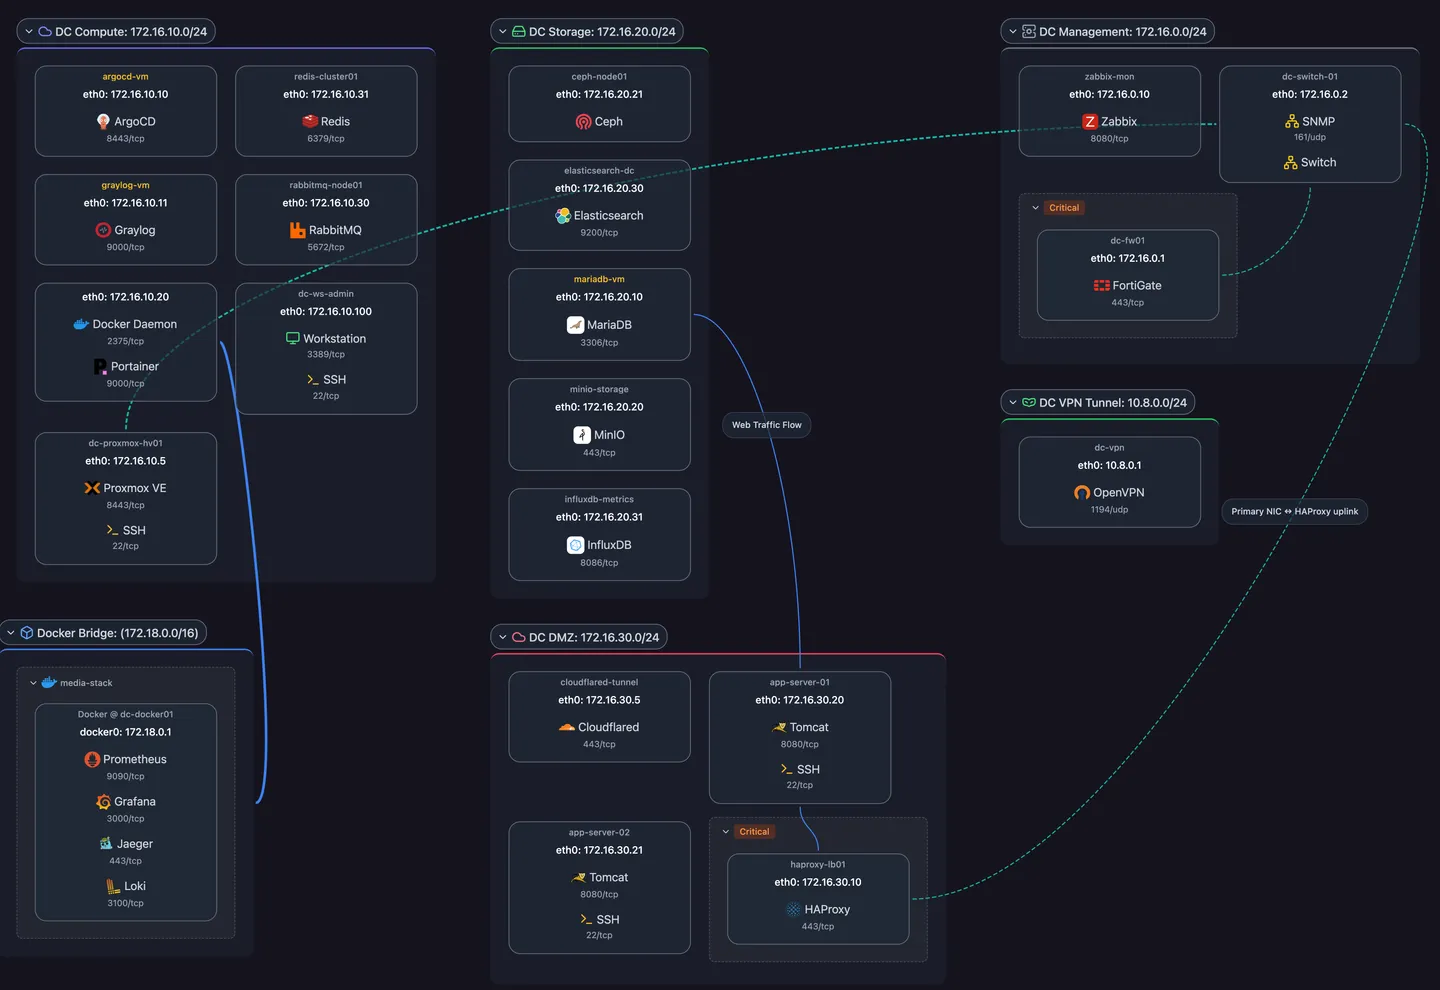
Subnets as containers
Each subnet holds the IP addresses discovery found in it, typed as LAN, WiFi, IoT, Guest, DMZ, and more. See VLANs & subnets.
Multi-homed hosts, connected
A host with addresses in several subnets shows a link between them, so you can see which machines bridge segments.
Click for the details
Select any address to see its host, the services on it, and the host’s other addresses.
Laid out by rules you set, not by dragging boxes
Automatic layout
Scanopy lays out every view automatically, so a rescan never leaves you with a diagram to tidy.
Group and filter
Group by subnet, host, service category, or tag. Filter by tag, link state, or how recently a device was seen.
On your schedule
Set each discovery to rescan on a day and time, or with a cron expression.

IT department
Municipality - Sweden
"With over 800 switches in our network, keeping topology documentation up to date by hand is almost impossible. We needed automation, especially with NIS2 raising the documentation requirements. Scanopy keeps it current for us."
Solutions built on Network topology
Frequently asked questions
What does Scanopy need to map physical topology?
SNMP read access to your switches (v1, v2c, or v3), or gNMI on switches that support it. UniFi and HPE Aruba Instant On networks can use their controller instead. Devices that don’t advertise LLDP or CDP are linked from switch forwarding tables where possible.
Is this a monitoring tool?
No. Scanopy documents what is on the network and how it connects, and rebuilds that on a schedule. It runs alongside your monitoring tools, which track health, bandwidth, and alerts.
Can I get the diagram into Visio or draw.io?
Yes, on plans that include those formats. The map also exports as PNG, SVG, PDF, HTML, Mermaid, or Confluence markup, embeds live in a wiki, or shares by read-only link. See sharing, embeds & exports.