Your network documentation is already outdated. Scanopy keeps it current, automatically.
Declared documentation that holds up until drift, manual changes, or anything provisioned outside the pipeline.
Snapshots accurate when someone last updated them. Fiction by month two.
Implicit documentation that walks out the door when people leave.
Observed network documentation that reflects what's actually running. Every host, every dependency, 270+ services.
Visualize your whole network, and everything running on it
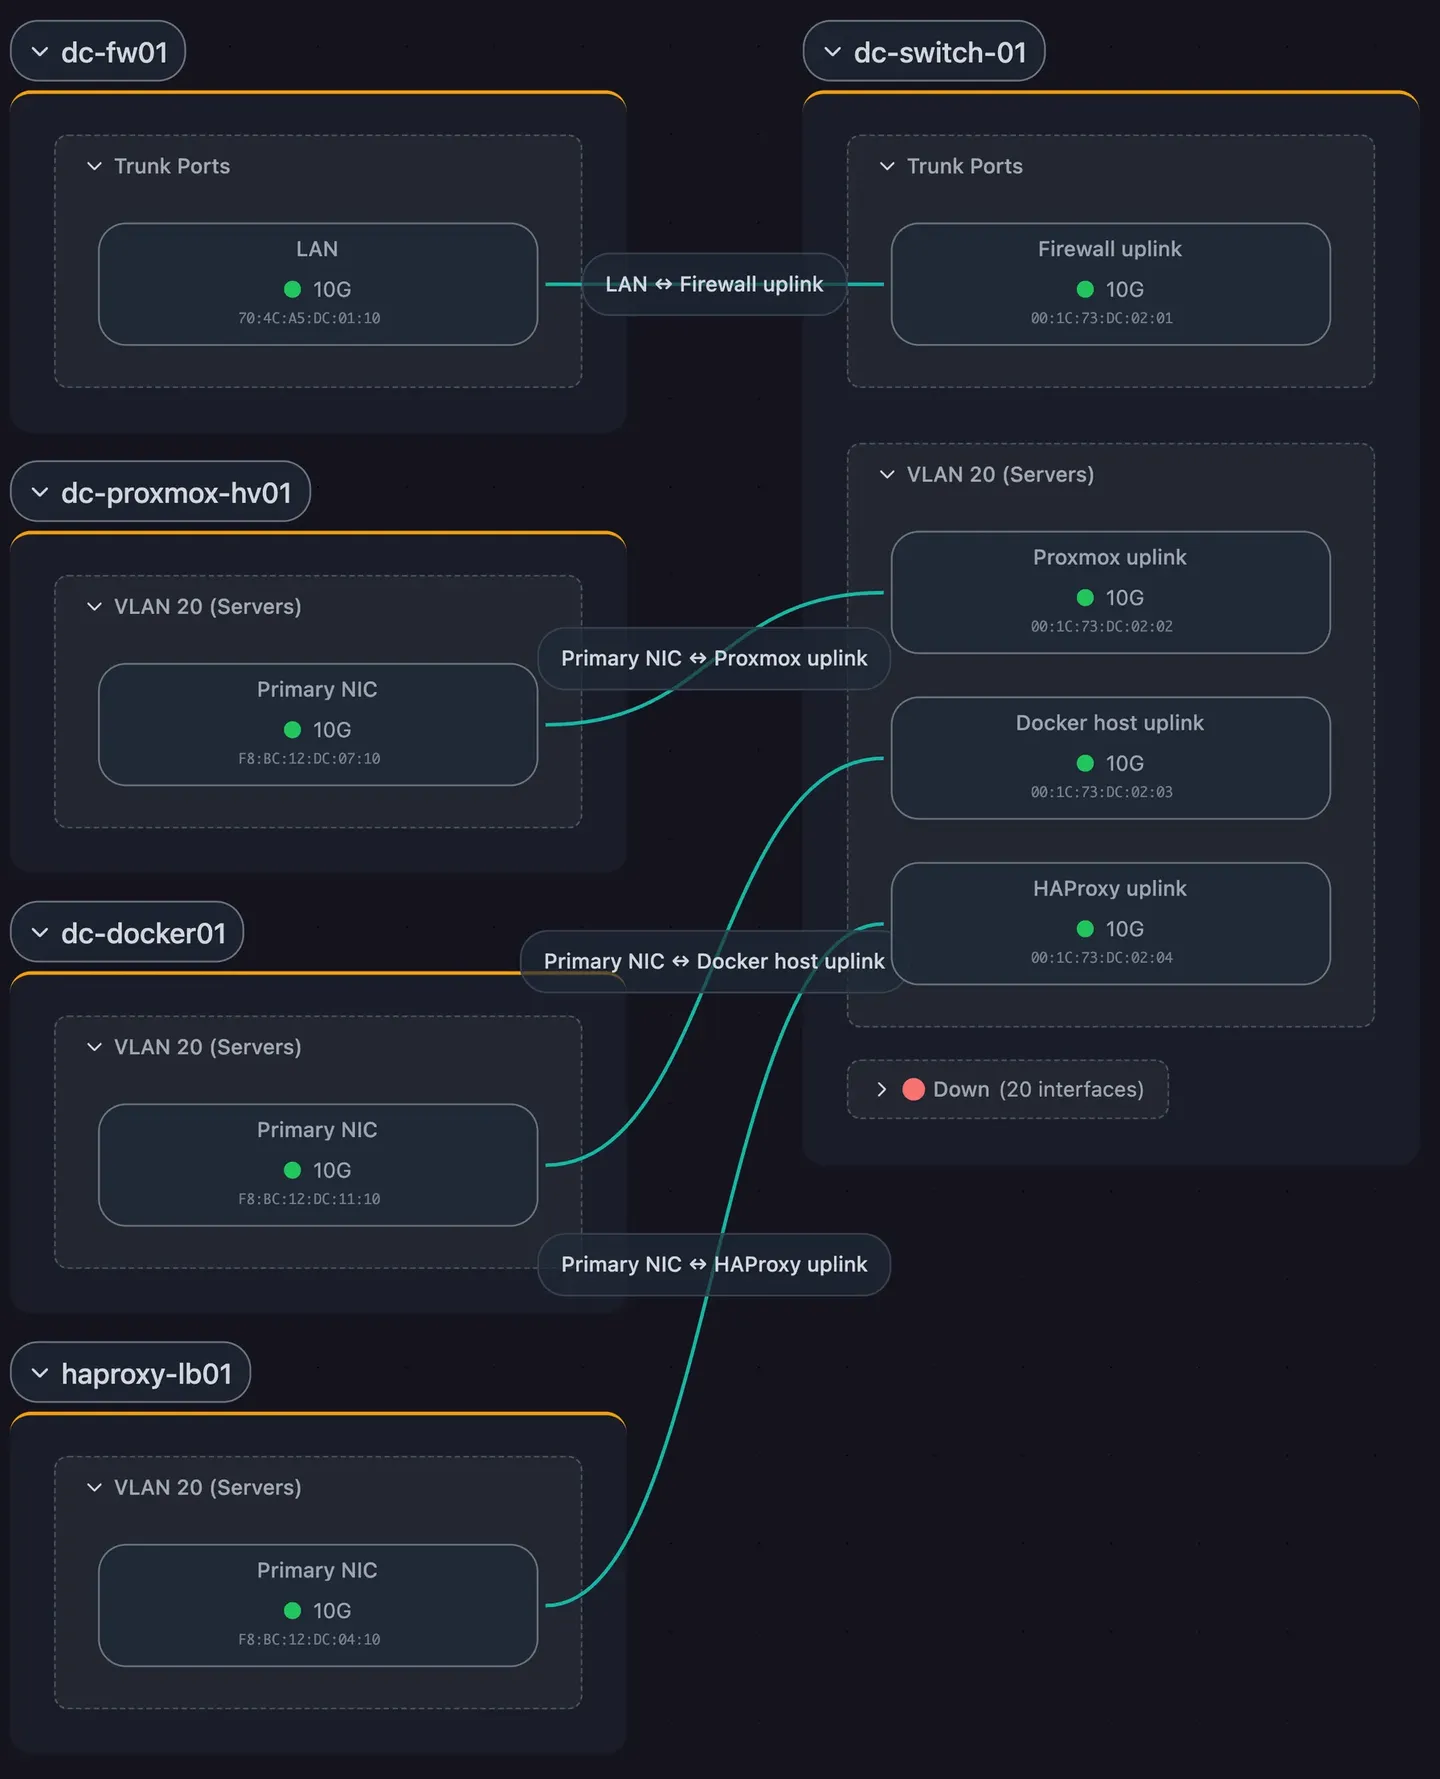
How are our switches wired?
Every switch, every port, every link, with VLANs and port status.
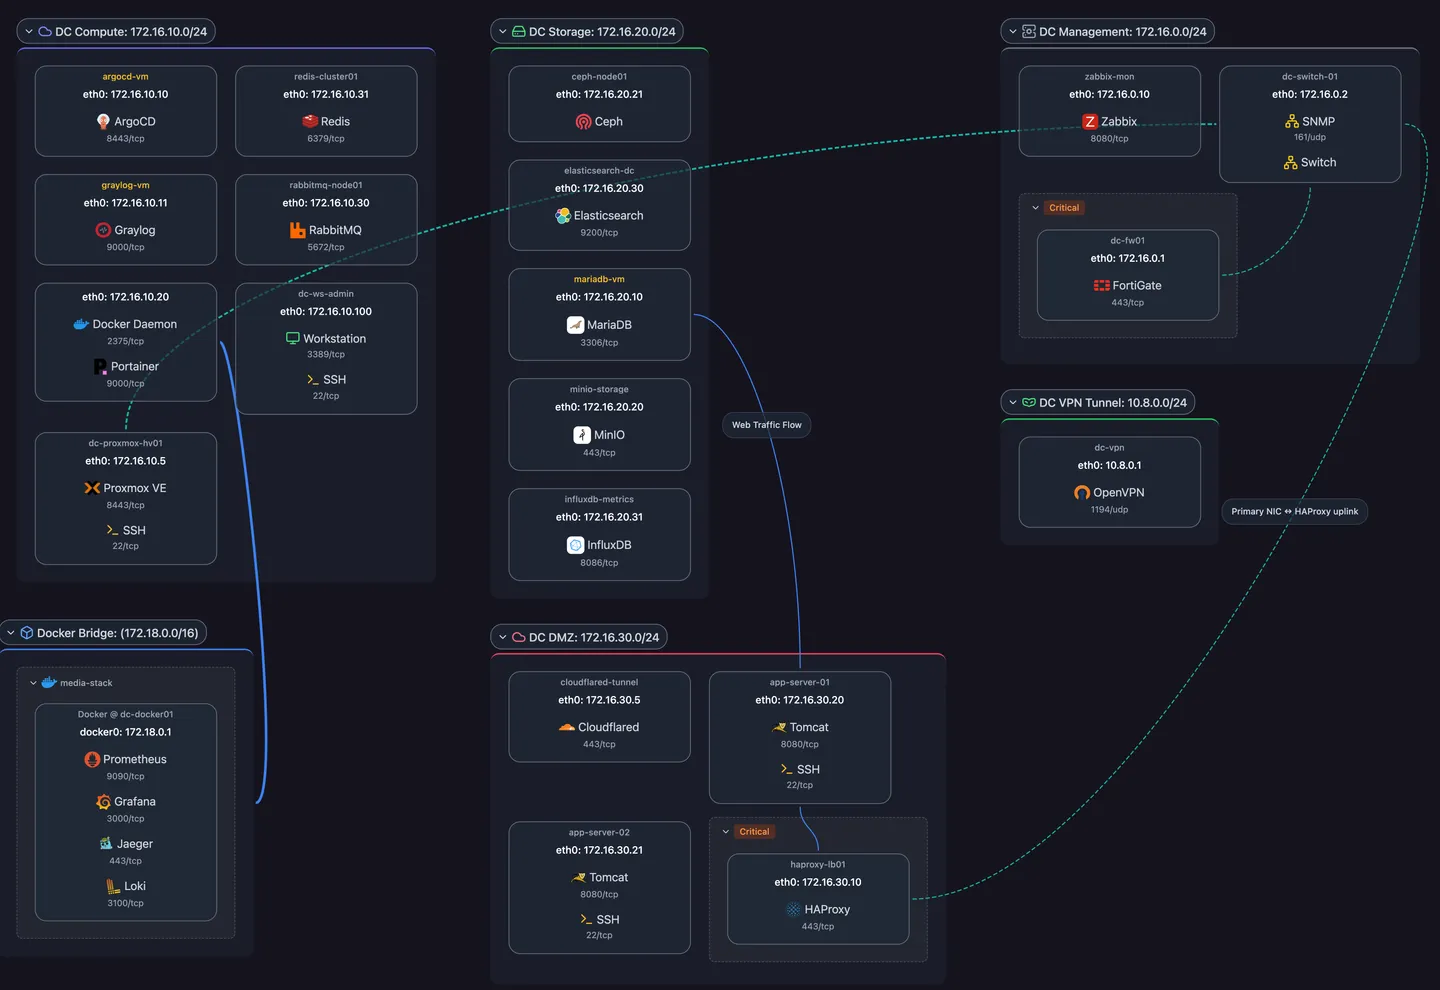
How is our network segmented?
Subnets and how hosts connect across them.
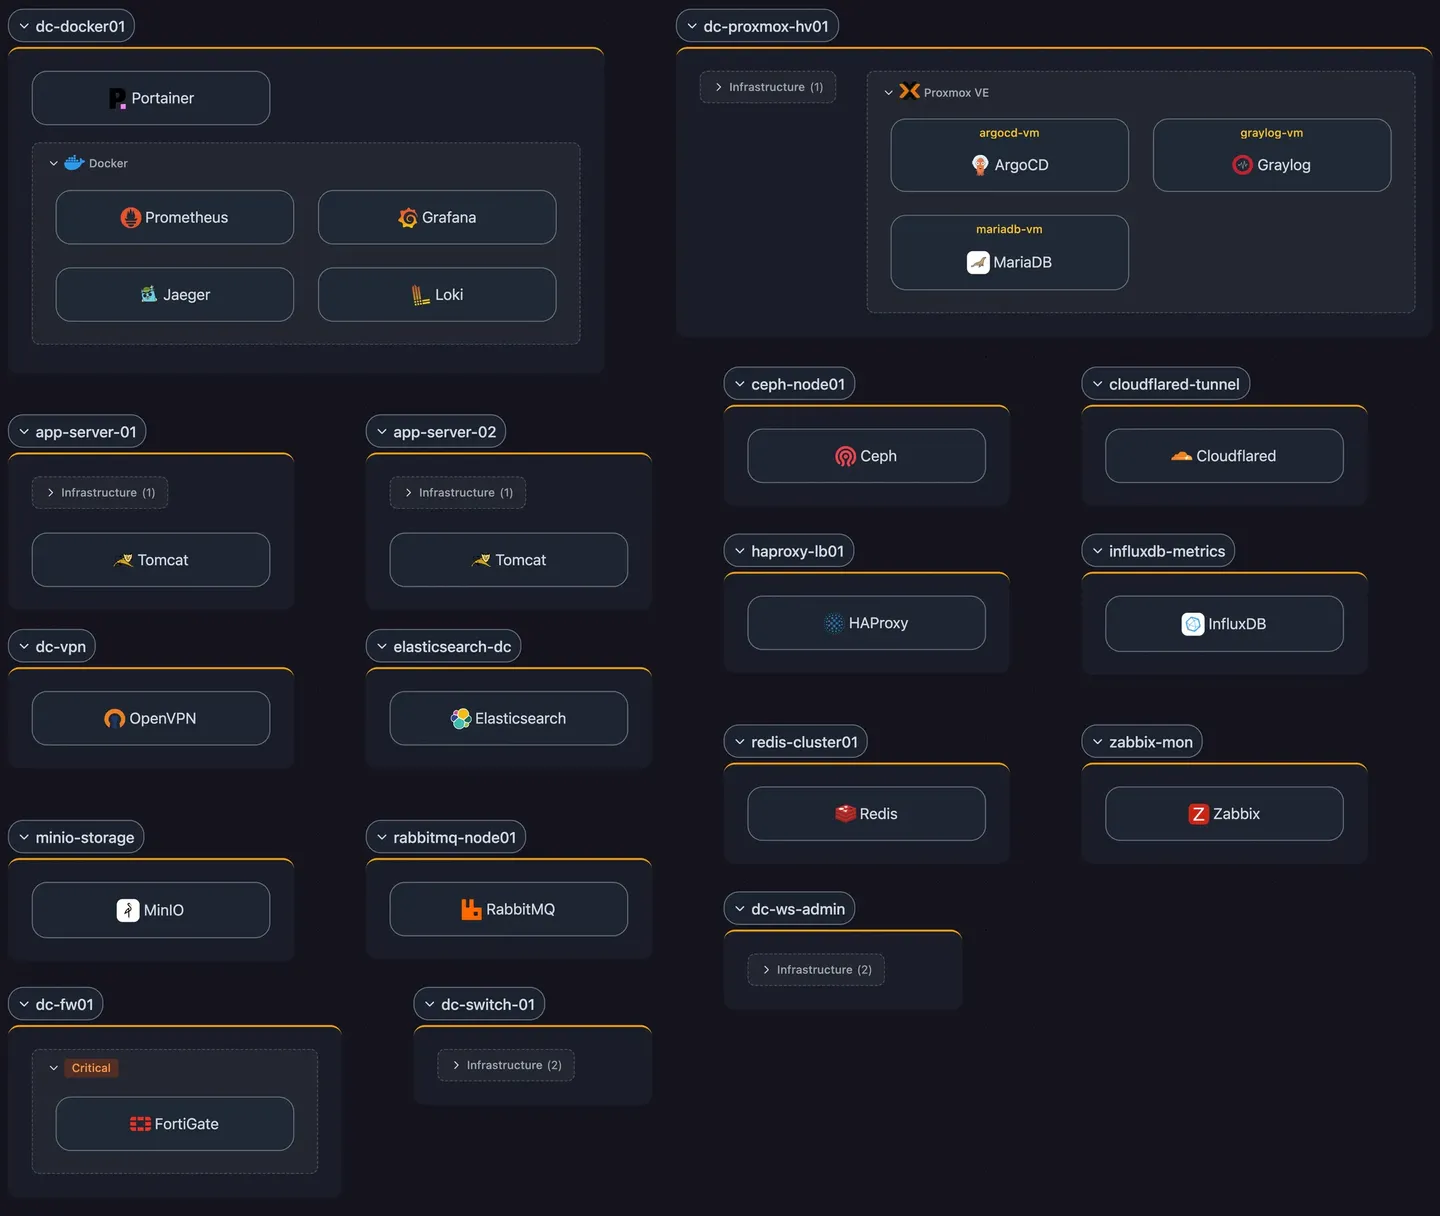
What runs where?
Bare metal to hypervisors to containers. The full nesting chain in one model.
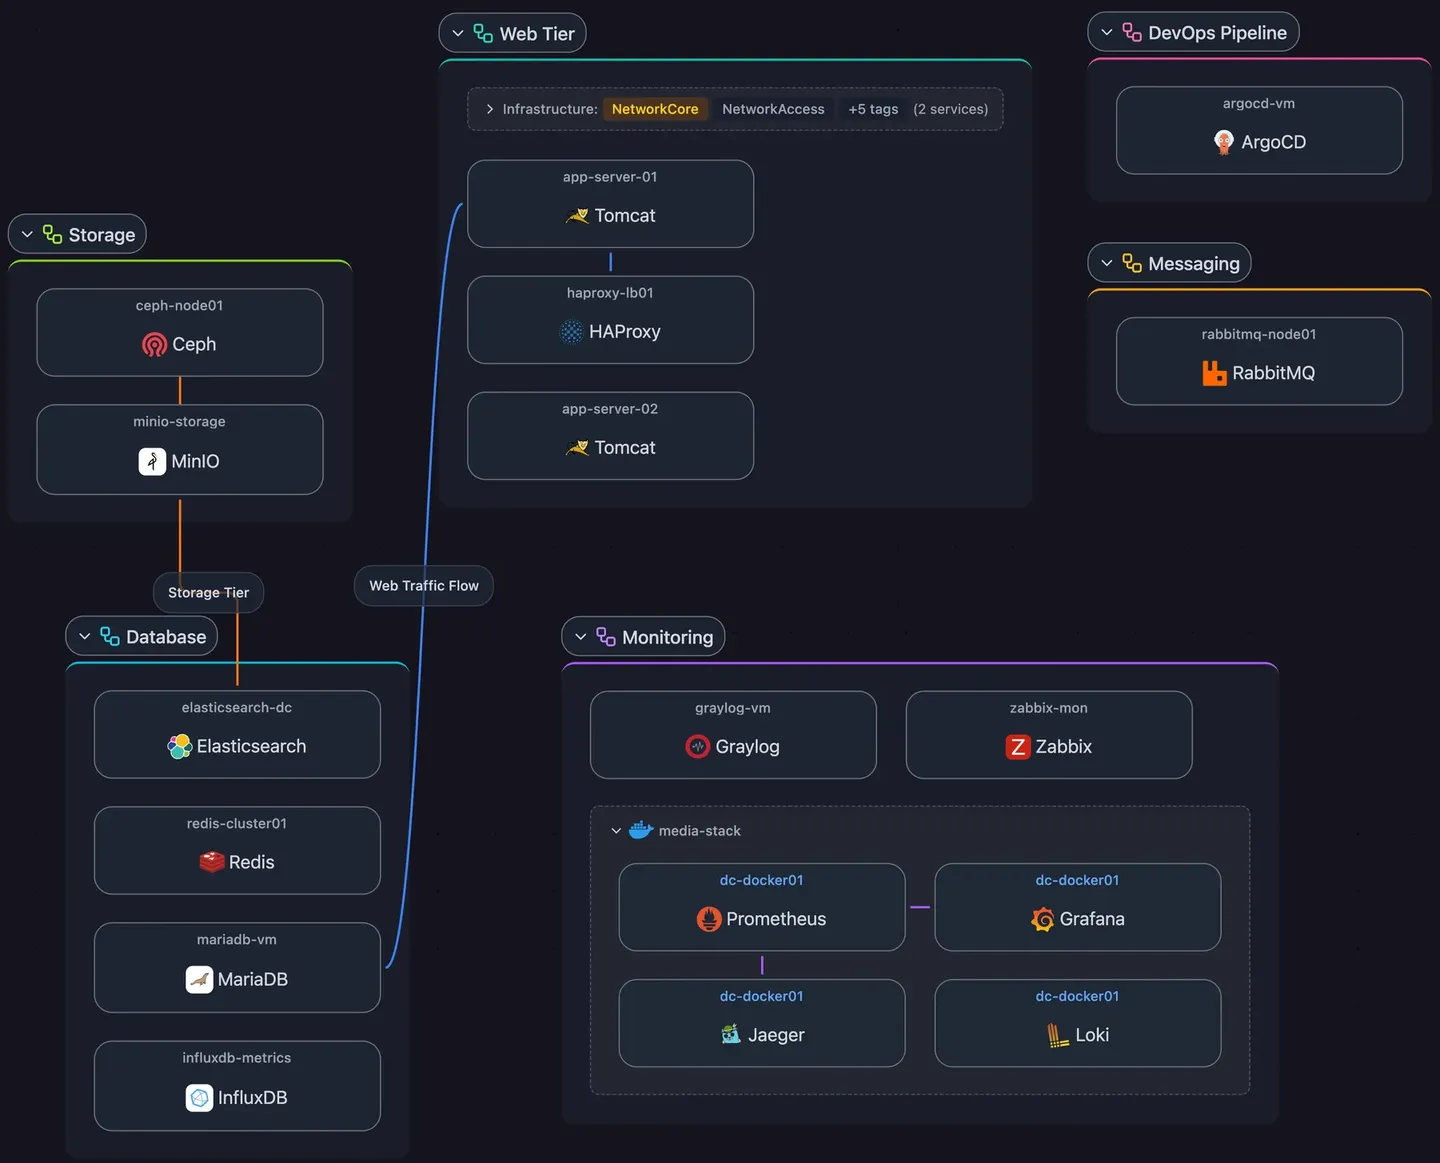
How are our applications structured?
Services and their dependencies, grouped by application.
Fewer fires. Safer changes. Smoother handoffs. Faster onboarding.
Reduce incident response time
See a broken service's dependency chain. Troubleshoot from understanding, not memory.
De-risk changes
Before migrating, resubnetting, or decommissioning a host, see what depends on it.
Simplify post-mortems
Versionable network state shows what changed before something broke.
Eliminate audit scrambles
Export current topology as SVG, PNG, Mermaid, or Confluence markup. One audit-ready artifact per cycle.
Give clients live maps
Shareable live links and embeddable maps, per client. No logins, no stale screenshots.
Onboard engineers faster
New engineers get the infrastructure picture on day one. Four current views, not a stale wiki.
Deploy once. Scanopy does the rest.
Deploy a scanner
Install a lightweight daemon on any network segment. It discovers hosts, services, subnets, switches, and workloads.
Four views generate automatically
Physical (L2), Logical (L3), Workloads, and Applications. All from one scan.
Stays accurate on a schedule
Rescans on your cadence, so the model never goes stale.
Run Scanopy on your own infrastructure.
Book a demo for a walkthrough, or get a license from the Scanopy app.
Frequently asked questions
What is Scanopy?
Scanopy is automated network diagram and documentation software. You deploy one lightweight scanner and it discovers your hosts, maps Layer 2 and Layer 3 topology, and fingerprints the services running on each host, turning your live network into four documentation views that stay current on a schedule, instead of a diagram you redraw by hand.
How does Scanopy discover and document my network?
You install a single daemon on the network, with no agents on individual endpoints. It scans on a schedule, finds every host, subnet, switch, service, and workload, and correlates them into four switchable views: L2 physical, L3 logical, workloads, and applications. Each re-scan refreshes the documentation automatically, so it reflects the network as it is now rather than when someone last updated a diagram by hand.
Does Scanopy replace network monitoring tools like PRTG or Auvik?
No. Monitoring tools track device health, bandwidth, and alerts over time; Scanopy documents what is on your network and how it is connected. It runs alongside your monitoring stack rather than replacing it, and many teams run both. See the tool comparison for how it stacks up against specific products.
Is Scanopy free or open source?
Yes. The self-hosted Community Edition is free and open-source under AGPL-3.0, with one network and one seat. A Commercial self-hosted license raises those caps and adds Confluence export, email support, and more seats. Scanopy also offers hosted Cloud plans, and the pricing page lists every plan.
How often does Scanopy update the network diagram?
Scanopy runs scheduled scans (typically hourly to daily, depending on how often your network changes) and refreshes the documentation automatically each time. It is scheduled rather than continuous, so it keeps your maps current without polling the network around the clock.