Scanopy is for IT teams and MSPs who want a dedicated network diagram automation tool which works alongside their existing monitoring platform. PRTG Network Monitor is for teams already invested in the Paessler ecosystem who want built-in topology mapping alongside monitoring. The table below puts the two side by side on discovery, the four topology views, pricing, and licensing, including PRTG Network Monitor's trade-offs.
Scanopy vs PRTG Network Monitor: head to head
| Scanopy | PRTG Network Monitor | |
|---|---|---|
| DiscoveryProtocols used to find devices and map connections | SNMP LLDP CDP ARP TCP/UDP | SNMP WMI ICMP [4] |
| Service detectionWhether the tool fingerprints services per host (databases, web servers, containers) beyond simple port detection | Yes 240+ types | No |
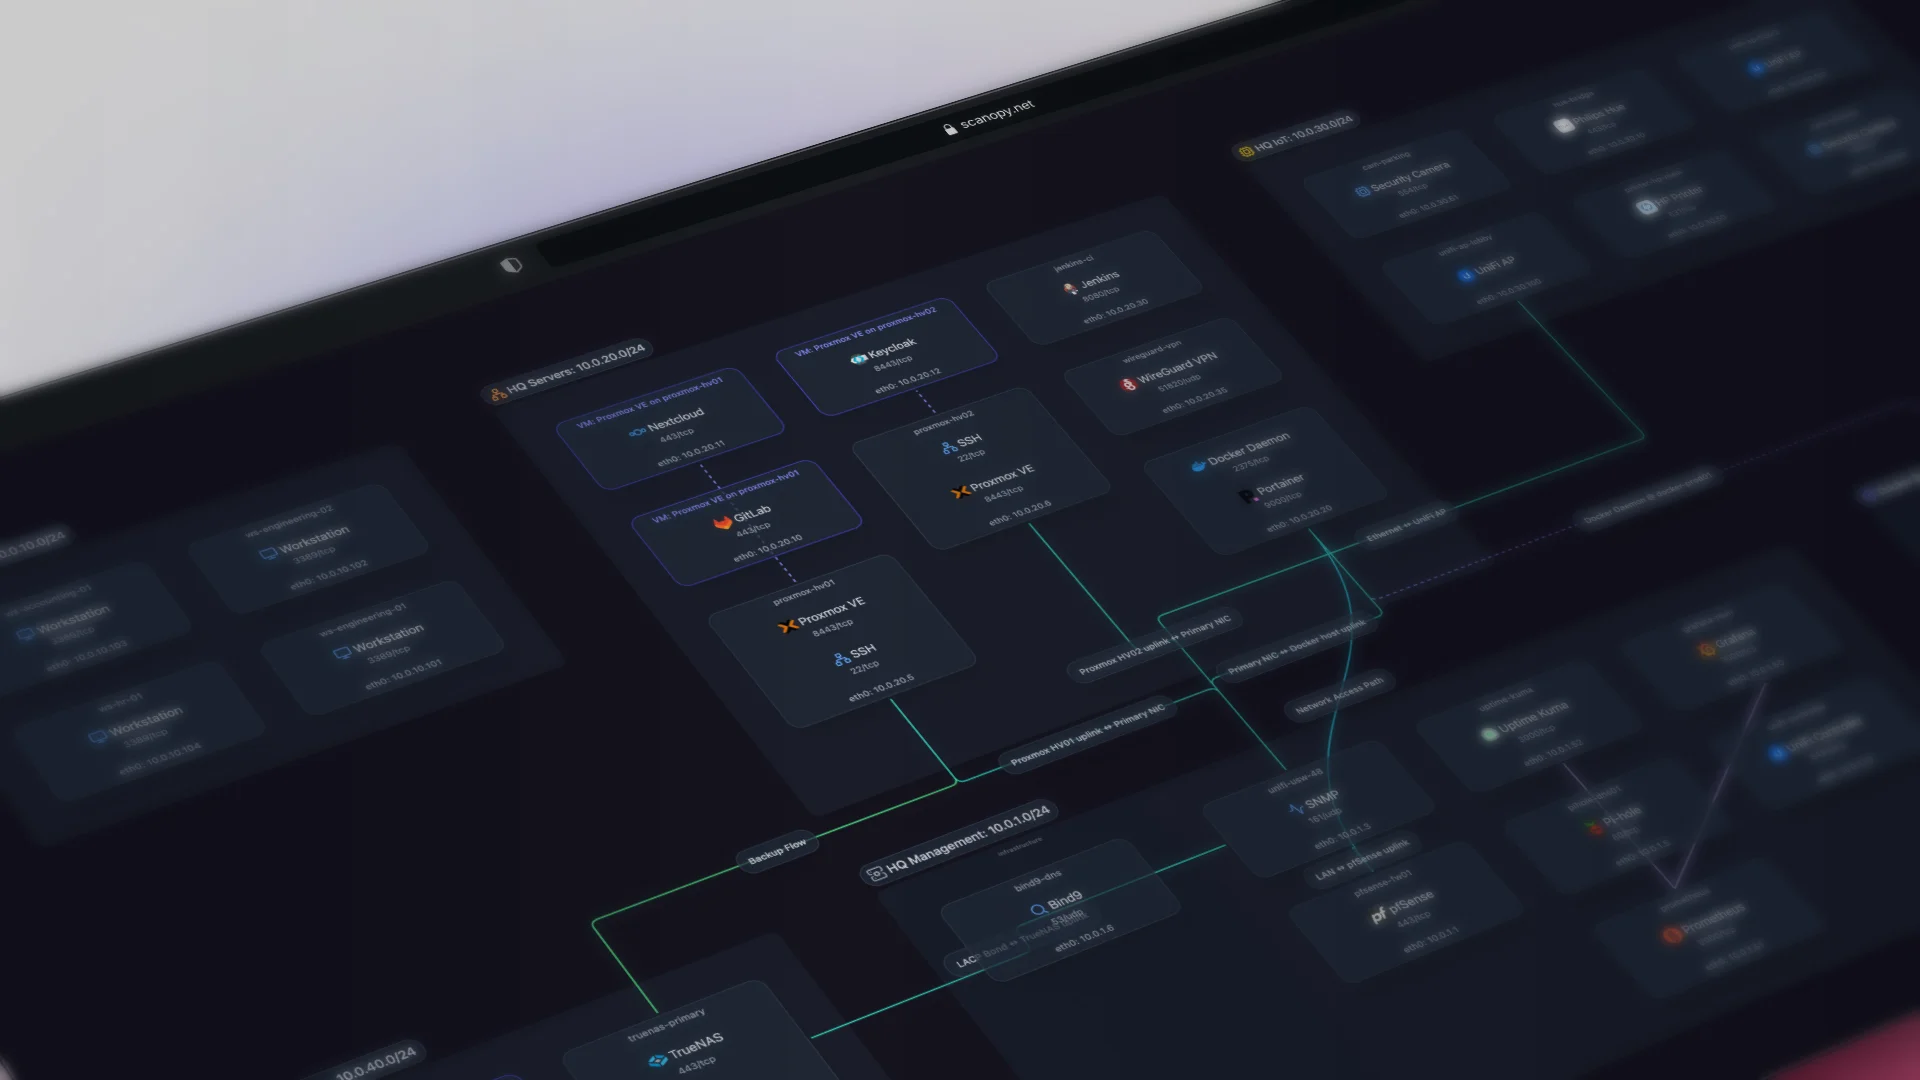
| Network ViewsWhich topology views the tool produces from discovery. L2 Physical switch ports and links L3 Subnets, VLANs, routing Workload VM/container host nesting Application Service-dependency / app grouping Yes supported Tag ? unverified Greyed not supported | No native auto L2/L3; automatic L2 maps require the third-party UVexplorer add-on. [32] | |
| Live updatesWhether the map updates automatically after the initial scan | Yes | Yes |
| Open sourceOSI means an OSI-approved open-source license; Source available means restricted; No means proprietary | OSI AGPL-3.0 | No |
| PricingStarting price or pricing model | Starts at $11.99 monthly, unlimited hosts | Free up to 100 sensors then tiered [4] |
| Also includesCapabilities beyond network diagramming | Docker Visualization | Monitoring Traffic Analysis |
When to choose which
Choose Scanopy when: You want a dedicated, living network-documentation tool: automatic L2, L3, workload, and application views, per-host service detection, flat pricing regardless of host count, and a free self-hostable Community edition. It sits alongside your monitoring stack rather than replacing it.
Choose PRTG Network Monitor when: If you already use PRTG for monitoring and want basic topology visibility, the built-in maps avoid adding another tool. The maps show what PRTG discovers, which is thorough.
This is a focused, two-tool comparison. For all 13 tools side by side, see the full comparison of automated network diagram tools.
Sources
Try Scanopy
Scanopy deploys a lightweight daemon that discovers your network and builds a live topology map. No per-device fees, unlimited hosts. It pairs with whatever monitoring tool you already use.
Started as a homelabber, now deep in SNMP MIBs, Layer 3 topology, and service fingerprinting - building the network documentation tool I wished existed.