
Topology
Interactive multi-perspective visualization of your infrastructure.
The topology generates an interactive visualization of your infrastructure, showing hosts, services, subnets, and their relationships. You can view your infrastructure from four perspectives, each answering a different question:
- L2 Physical: How is my network physically wired?
- L3 Logical: How is my network logically segmented?
- Workloads: Where does everything run, and what's inside what?
- Application: How do my services depend on each other?
Each perspective has its own grouping options and edge types.
L2 Physical
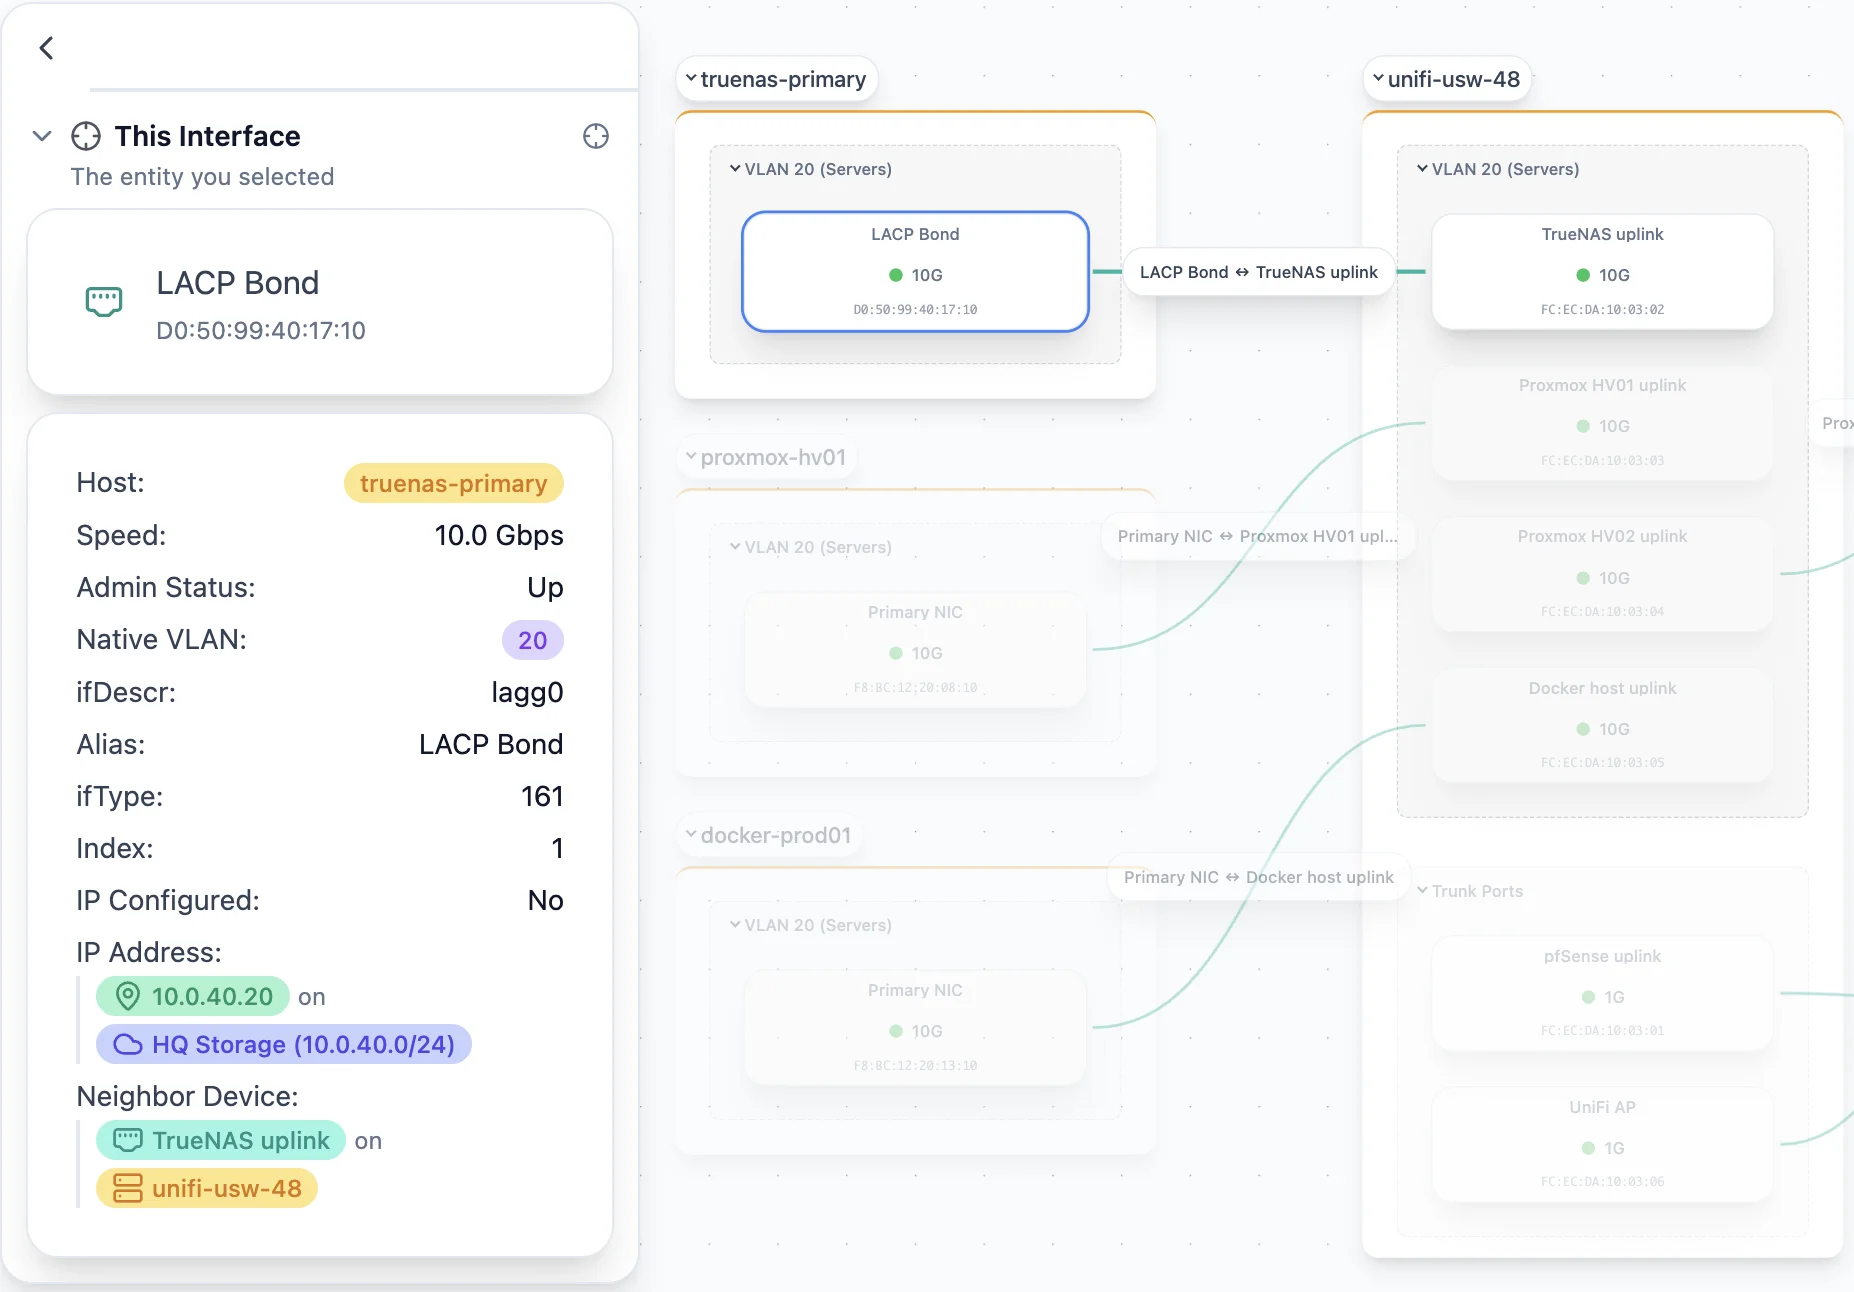
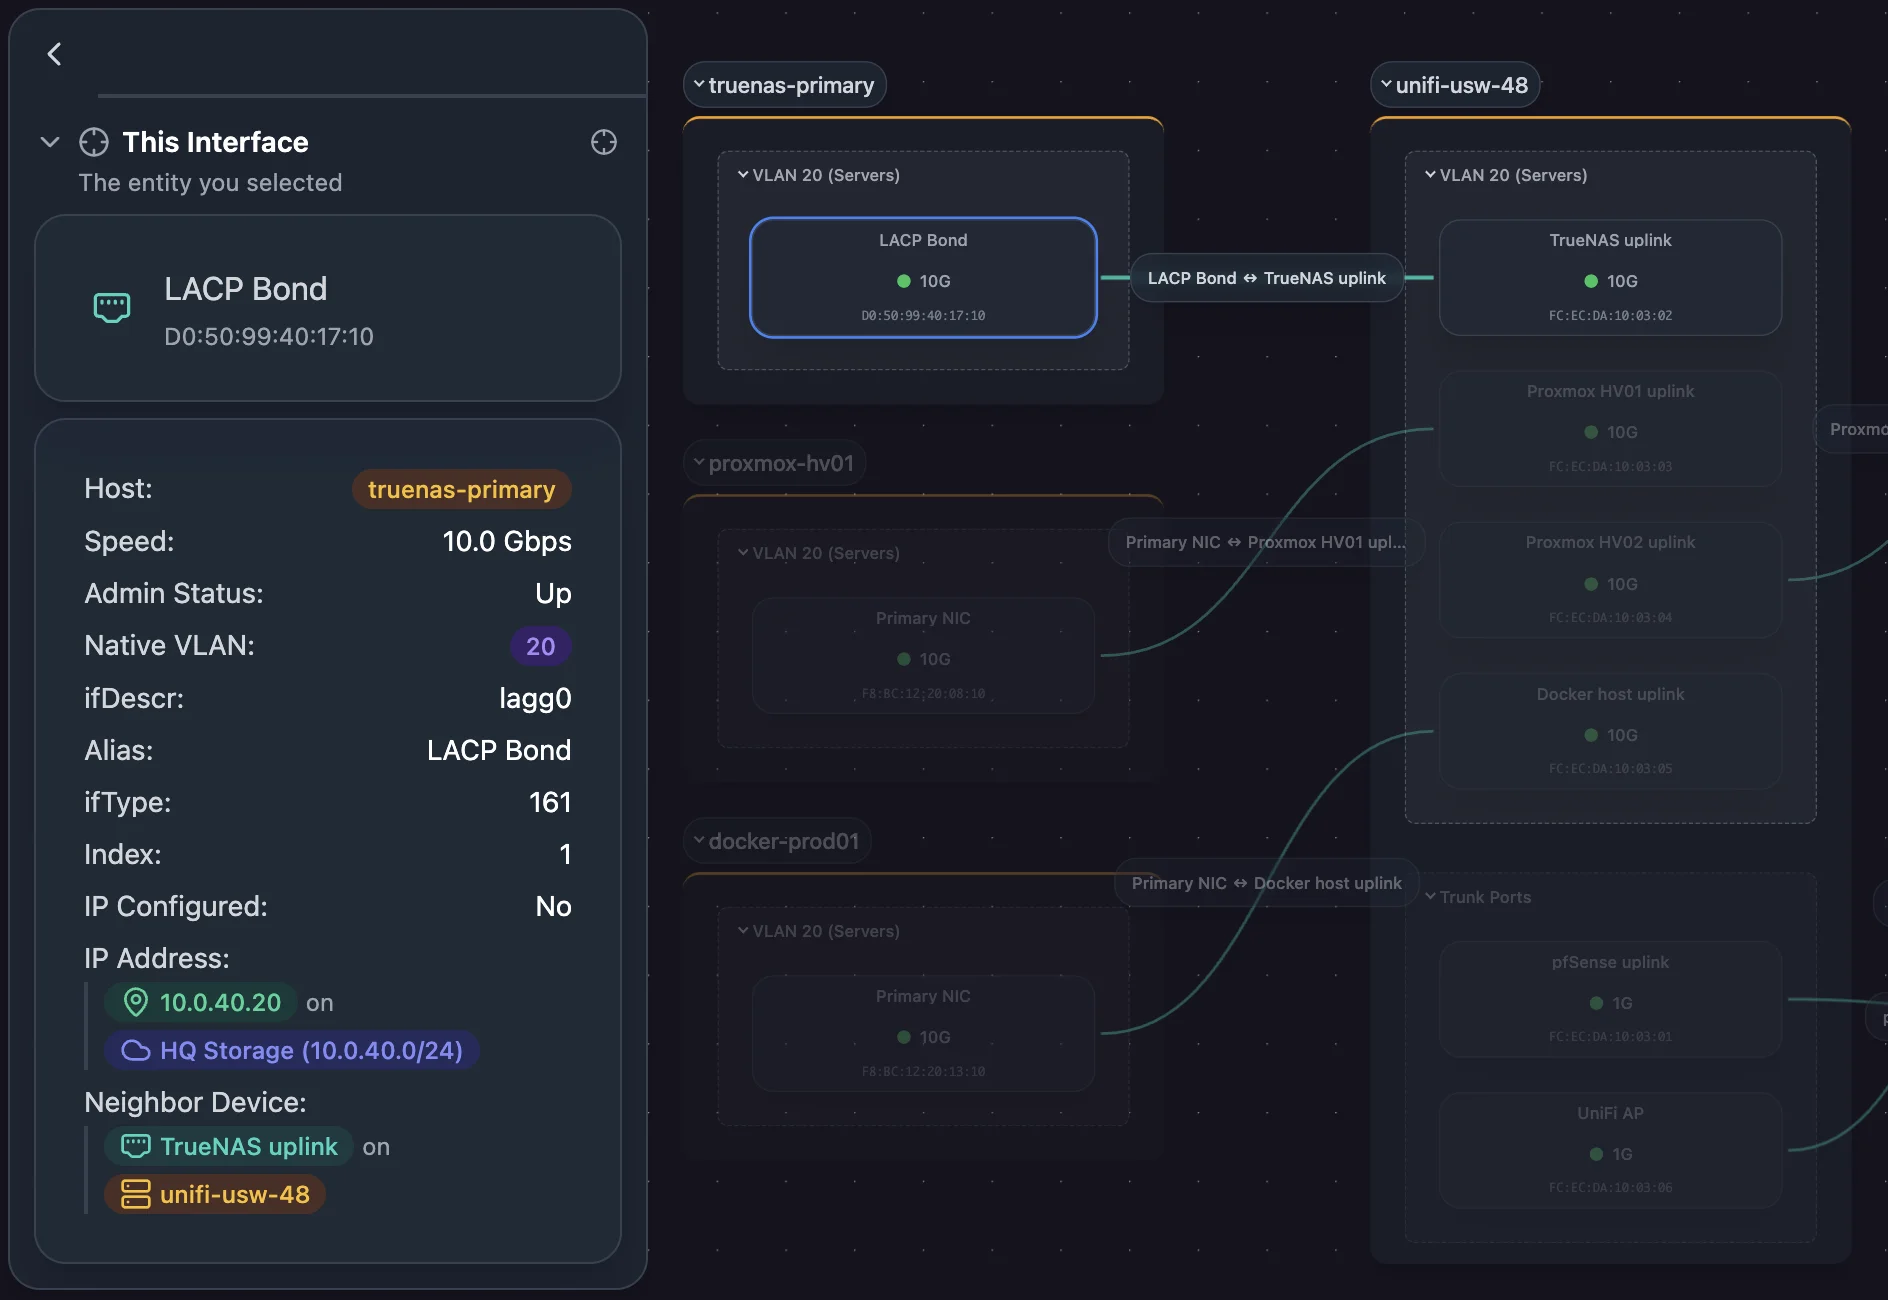
The L2 Physical perspective shows the cable-level shape of your network: which device is plugged into which port on which switch. It's built from LLDP and CDP neighbor data, so any device that reports neighbor information appears as a container in this view, with its interfaces and ports as nodes inside.
- Containers: Devices that report LLDP/CDP neighbors, typically managed switches and routers
- Nodes: Their interfaces and ports
- Connections: Physical links, derived from each side's neighbor table
LLDP and CDP run on managed network gear. Scanopy reads those neighbor tables from three places:
- The device itself, over SNMP. When a host is queried with valid SNMP credentials, its neighbor table is pulled and used to draw links between interfaces.
- The device itself, over gNMI. A device that serves gNMI reports the LLDP neighbors of each interface. See Set up gNMI discovery.
- A network controller, over its API. Some managed switches collect neighbor data internally but don't publish it over SNMP: a walk of the LLDP MIB returns nothing no matter what credentials you use. Where the vendor's controller holds that data, reading the controller recovers it. See Set up UniFi discovery.
All three sources feed the same resolution, so a link reported by a controller and the same link reported by the device at its other end are recognized as one cable rather than two.
Devices that don't report neighbor data from any of them don't appear here. That's expected for unmanaged switches and most endpoints.
L3 Logical
The L3 Logical perspective shows where every host appears in your network's IP address space. Subnets are containers, and each host is shown inside every subnet it has an address on. A host with addresses on multiple subnets bridges them, which shows which devices route, span, or otherwise touch multiple network segments.
This is the default perspective.
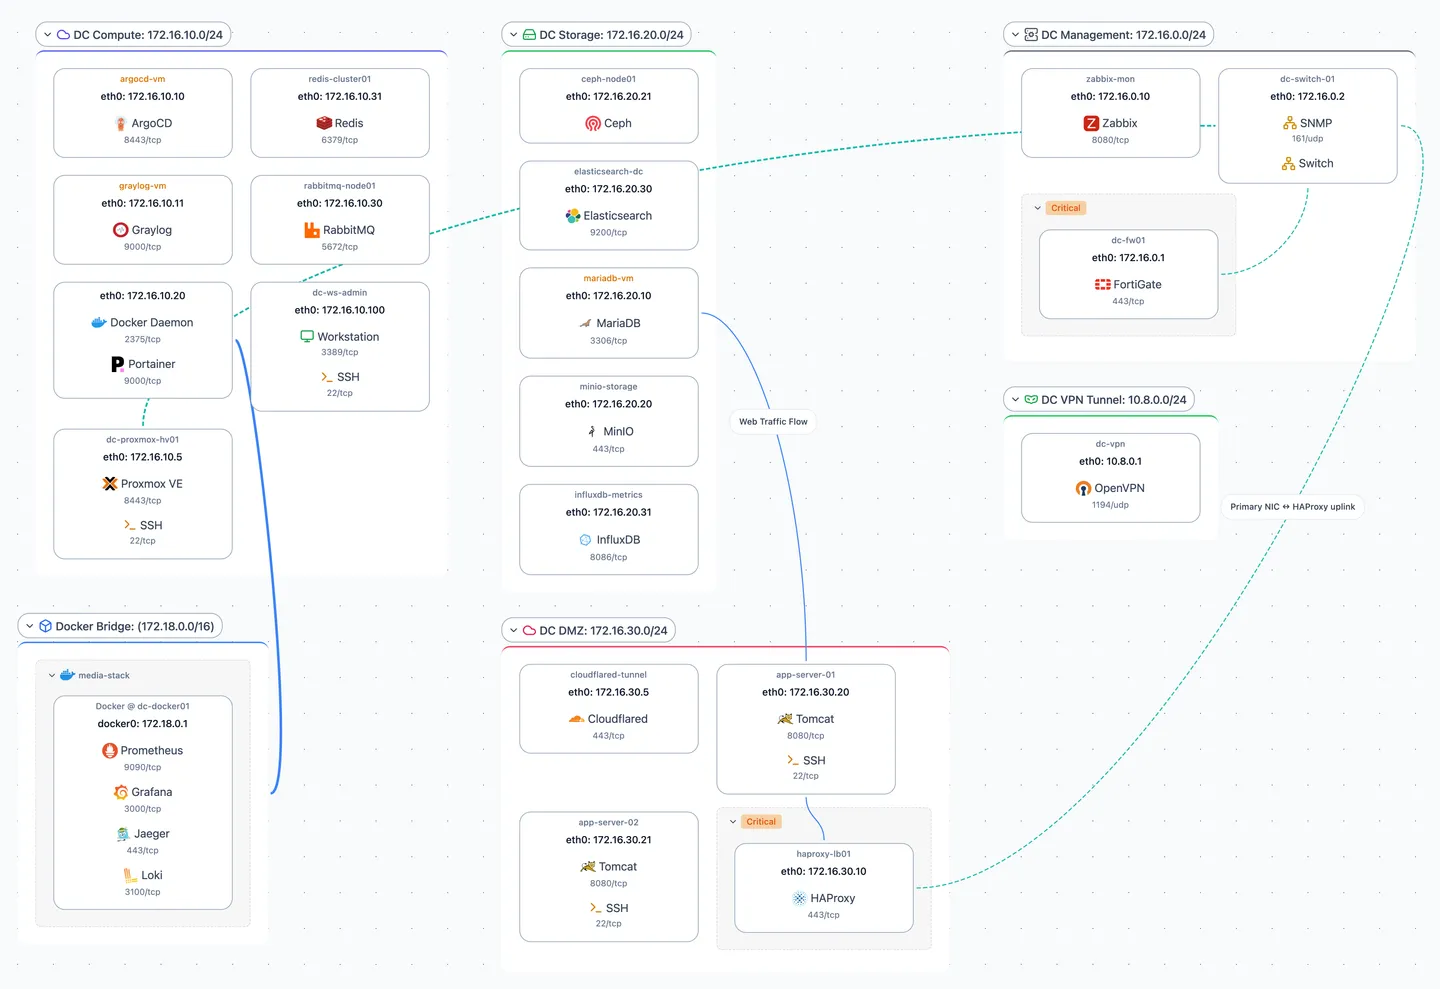
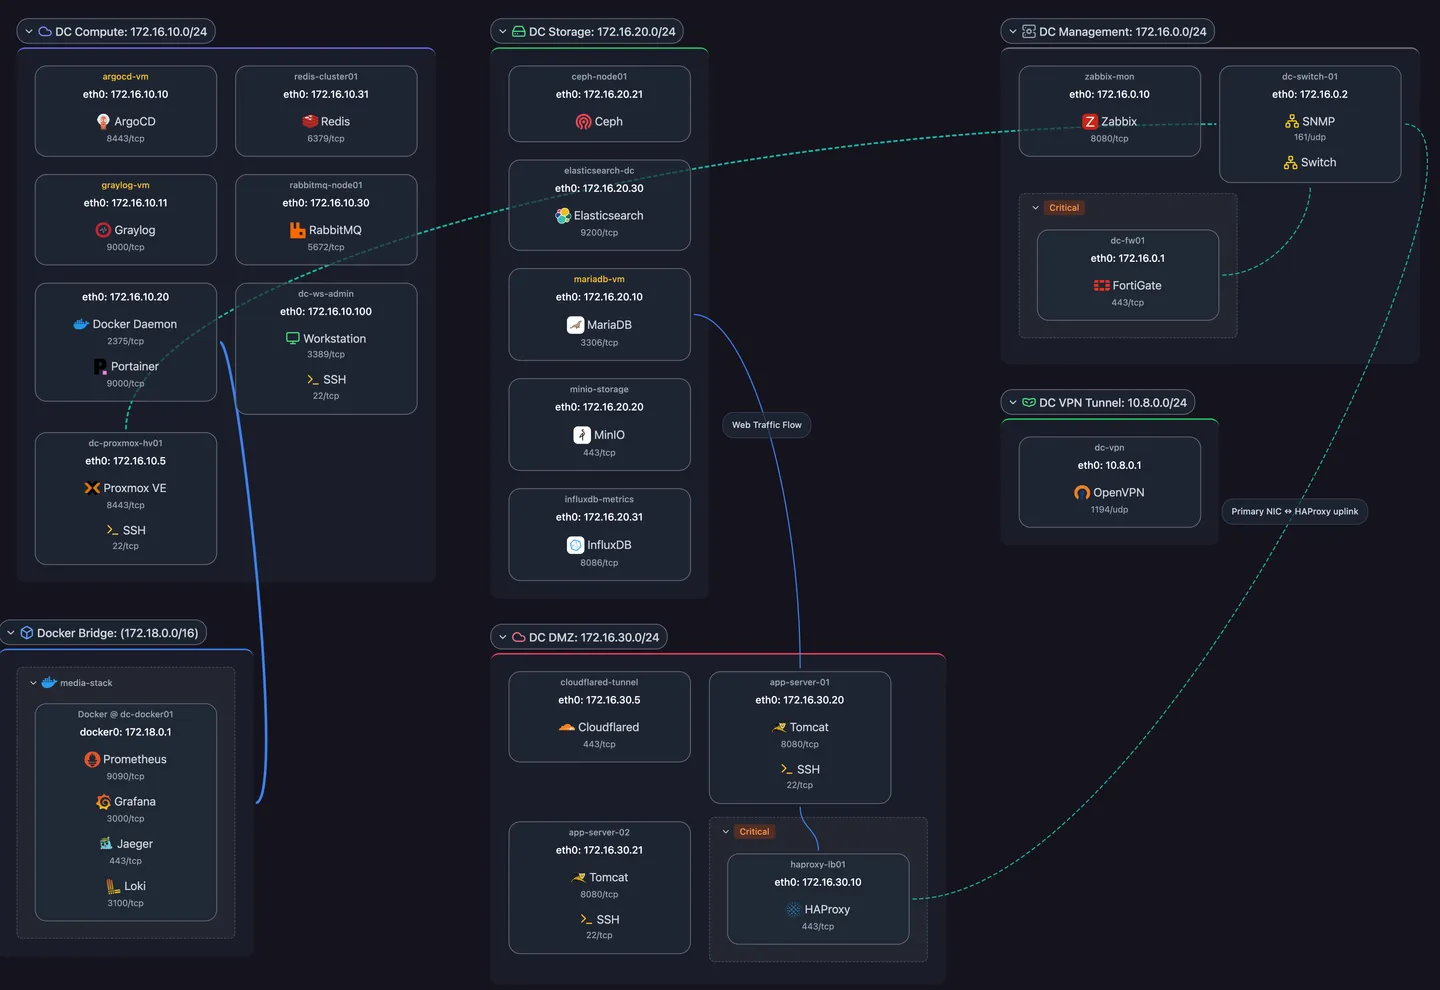
- Containers: Subnets, one per discovered network segment
- Nodes: Each host's presence in each subnet it has an address on
- Connections: Links between subnets where a single host has addresses on both, plus dependency overlays when configured with port-level detail
The view is built from your discovered subnets and the IP addresses found on each host's interfaces. It appears as soon as discovery runs.
Container networks on L3
Container hosts (Docker, Podman) attach their containers to one or more bridge networks, and each bridge network is a subnet on this view. A container that joins several bridges appears in each of those subnets.
Two overlays show container structure:
- Container Runtime connects each bridge subnet back to its host, showing which host runs the containers on that bridge.
- Same Container links the addresses of a single container that spans multiple bridge subnets, so a multi-attached container reads as one thing rather than as unrelated cards in separate subnet boxes. It's hidden by default.
The Container Bridges grouping rule collapses a host's bridge subnets into a single group. See Customizing views.
Workloads
The Workloads perspective shows your compute hierarchy. Hosts contain hypervisors, hypervisors contain VMs, VMs can contain container runtimes, and container runtimes contain containers. The nesting shows the relationships, so this view has no connection lines.
bare-metal-host
  └── Proxmox
        ├── vm-web-server
        │     └── Docker
        │           ├── nginx
        │           ├── app
        │           └── postgres
        └── vm-monitoring
              └── Docker
                    ├── grafana
└── prometheus- Containers: Hosts, with hypervisor and container-runtime sub-containers nested inside
- Nodes: Managed workloads: VMs, containers, and other virtualized resources
- Connections: None
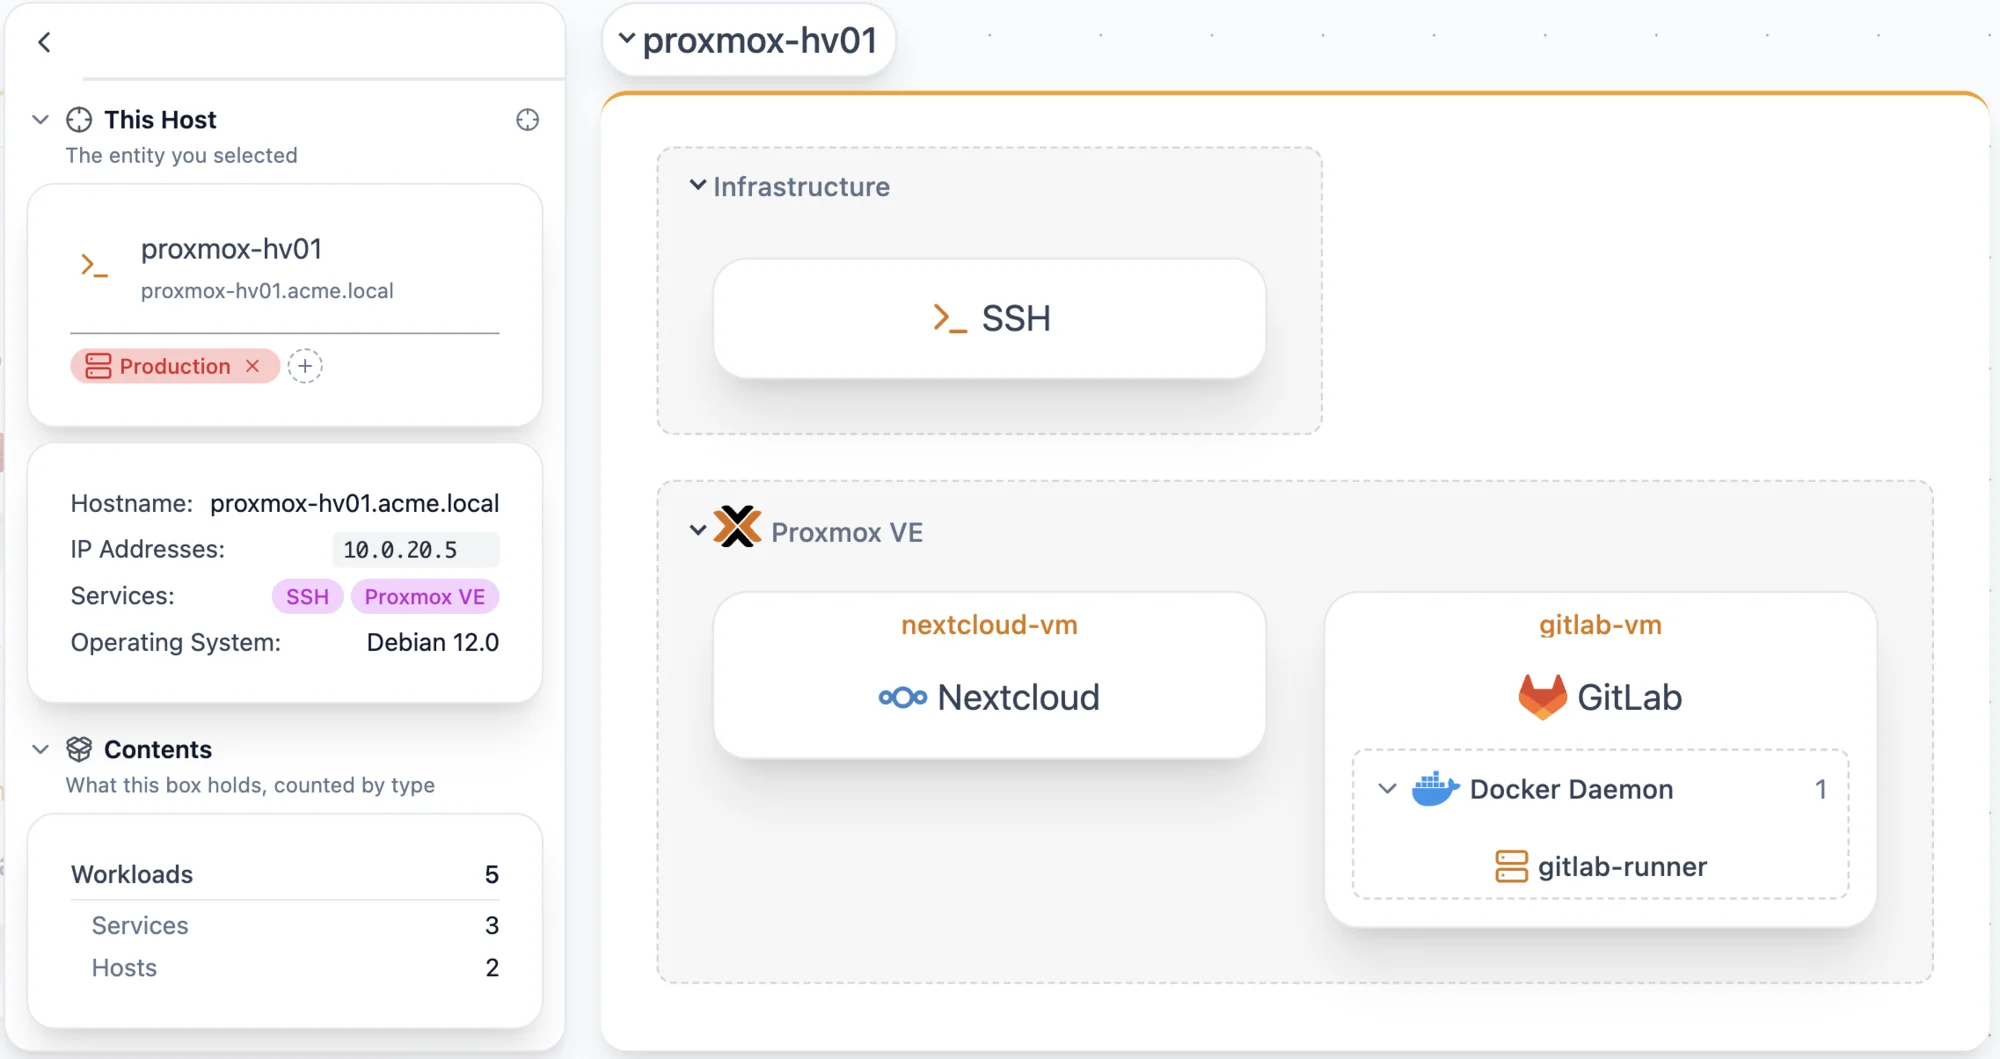
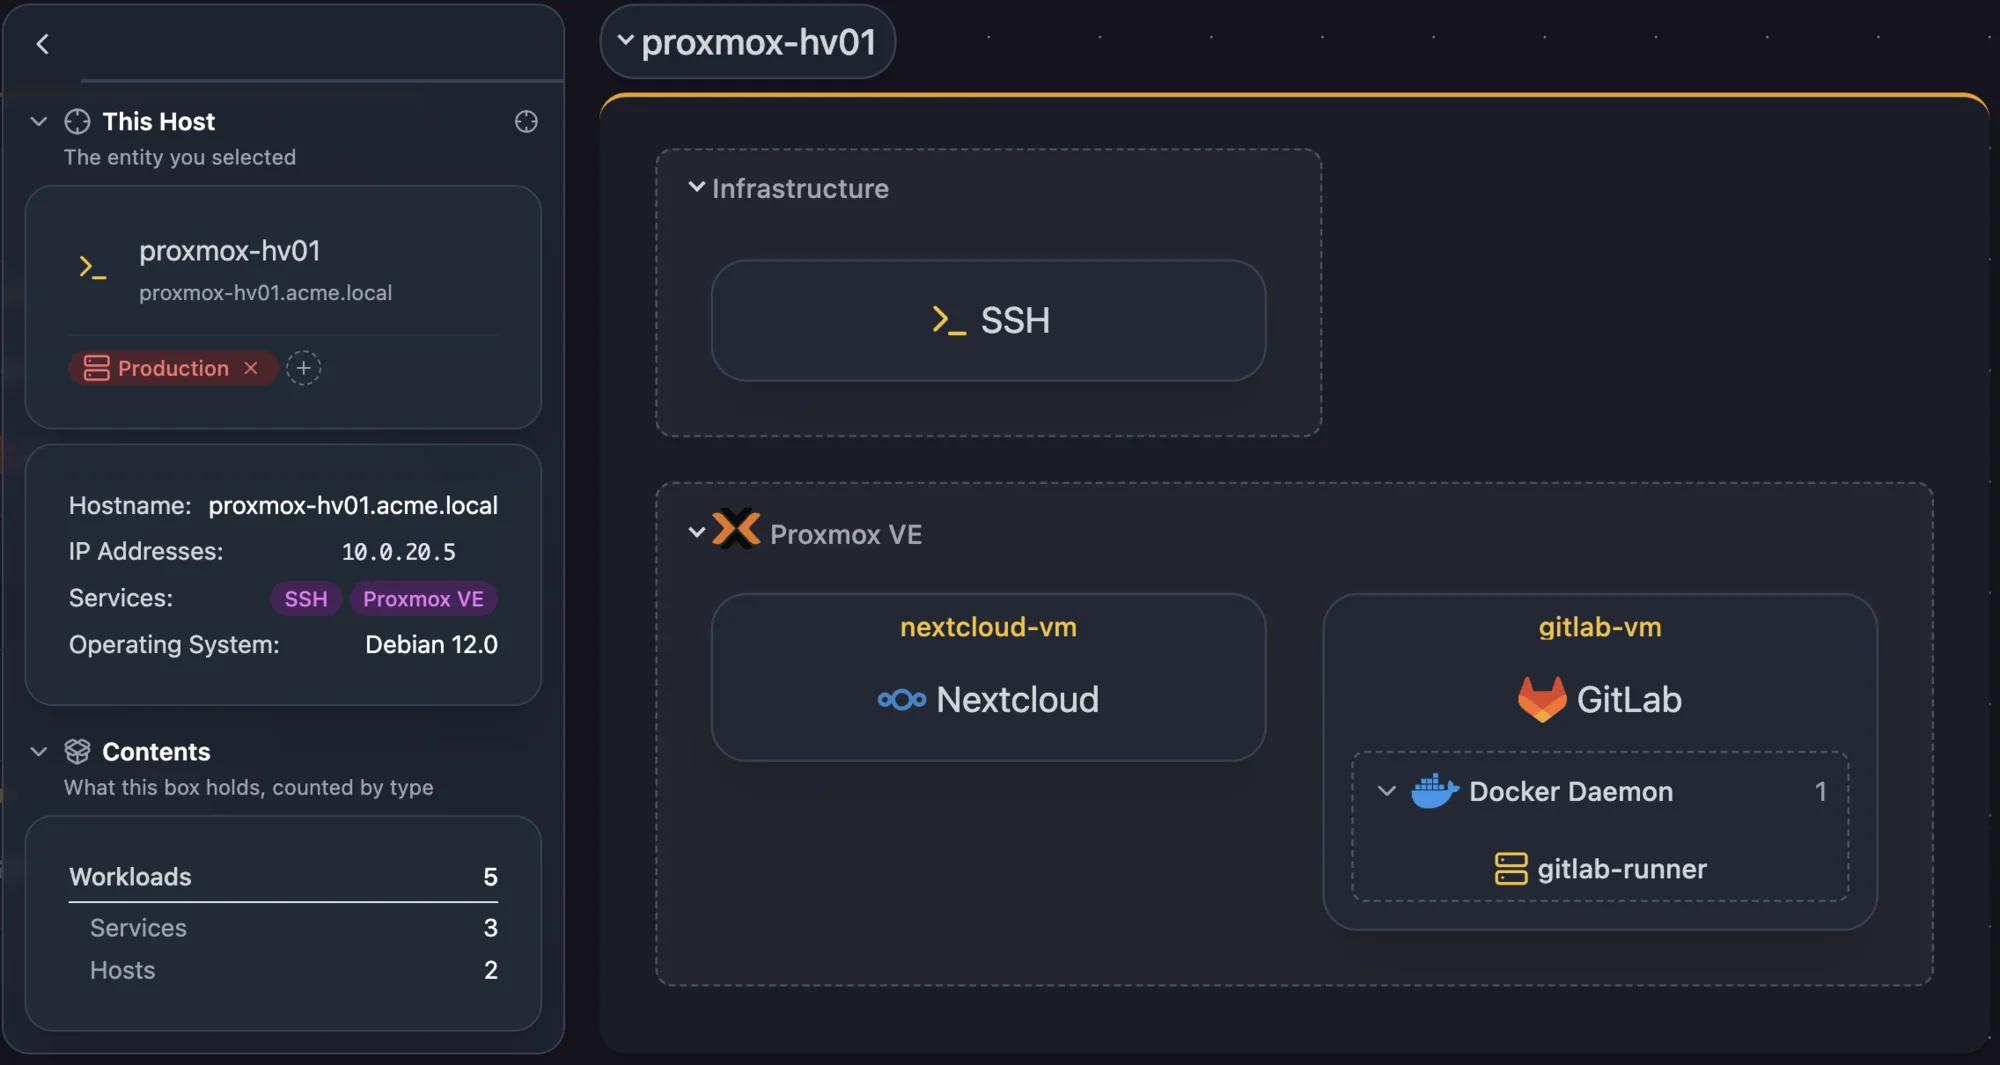
The hierarchy is built from virtualization relationships on each entity: a VM points at the hypervisor service that runs it, and a container points at the container runtime service that runs it.
- Docker and Podman containers populate when a Docker or Podman credential is configured.
- Proxmox VE VMs and LXC containers populate when a Proxmox VE credential is assigned to a node.
- VMs managed by vCenter or ESXi are linked through the virtualization assignment UI.
See Virtualization Relationships.
Application
The Application perspective shows your services grouped by application, with dependencies as the connections between them. Generic infrastructure services such as SSH, NTP and DHCP are hidden by default.
- Containers: Application groups, one per application tag you've defined
- Nodes: Services that belong to those applications
- Connections: Dependencies
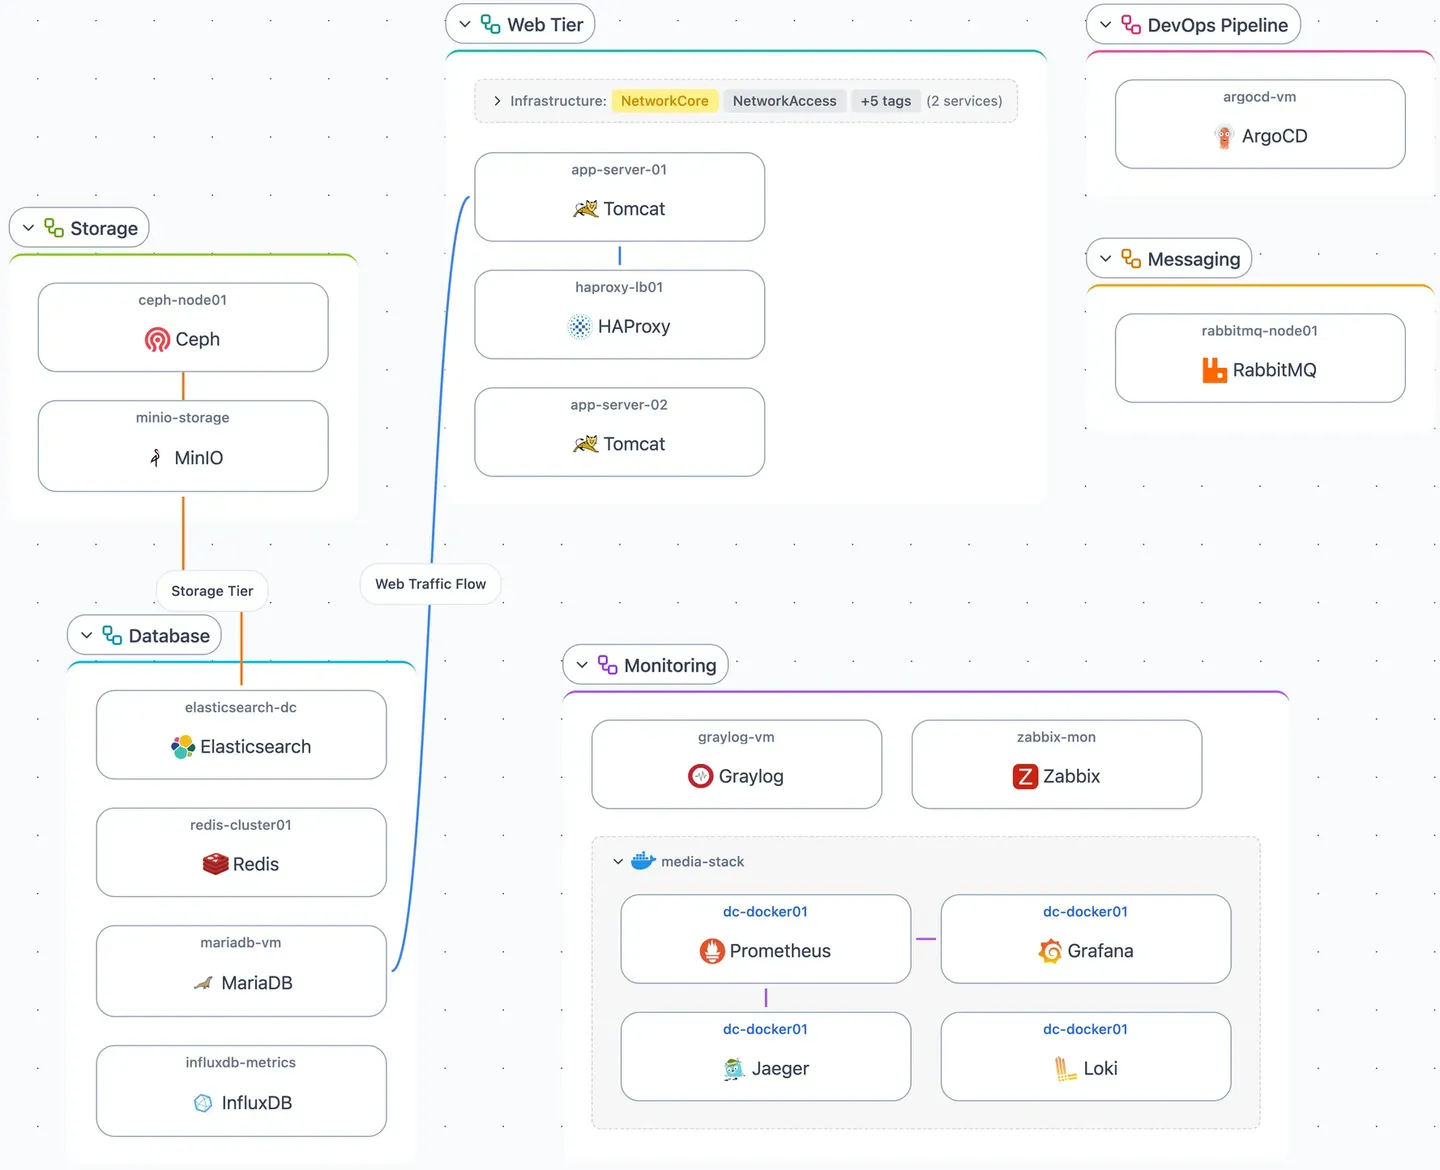
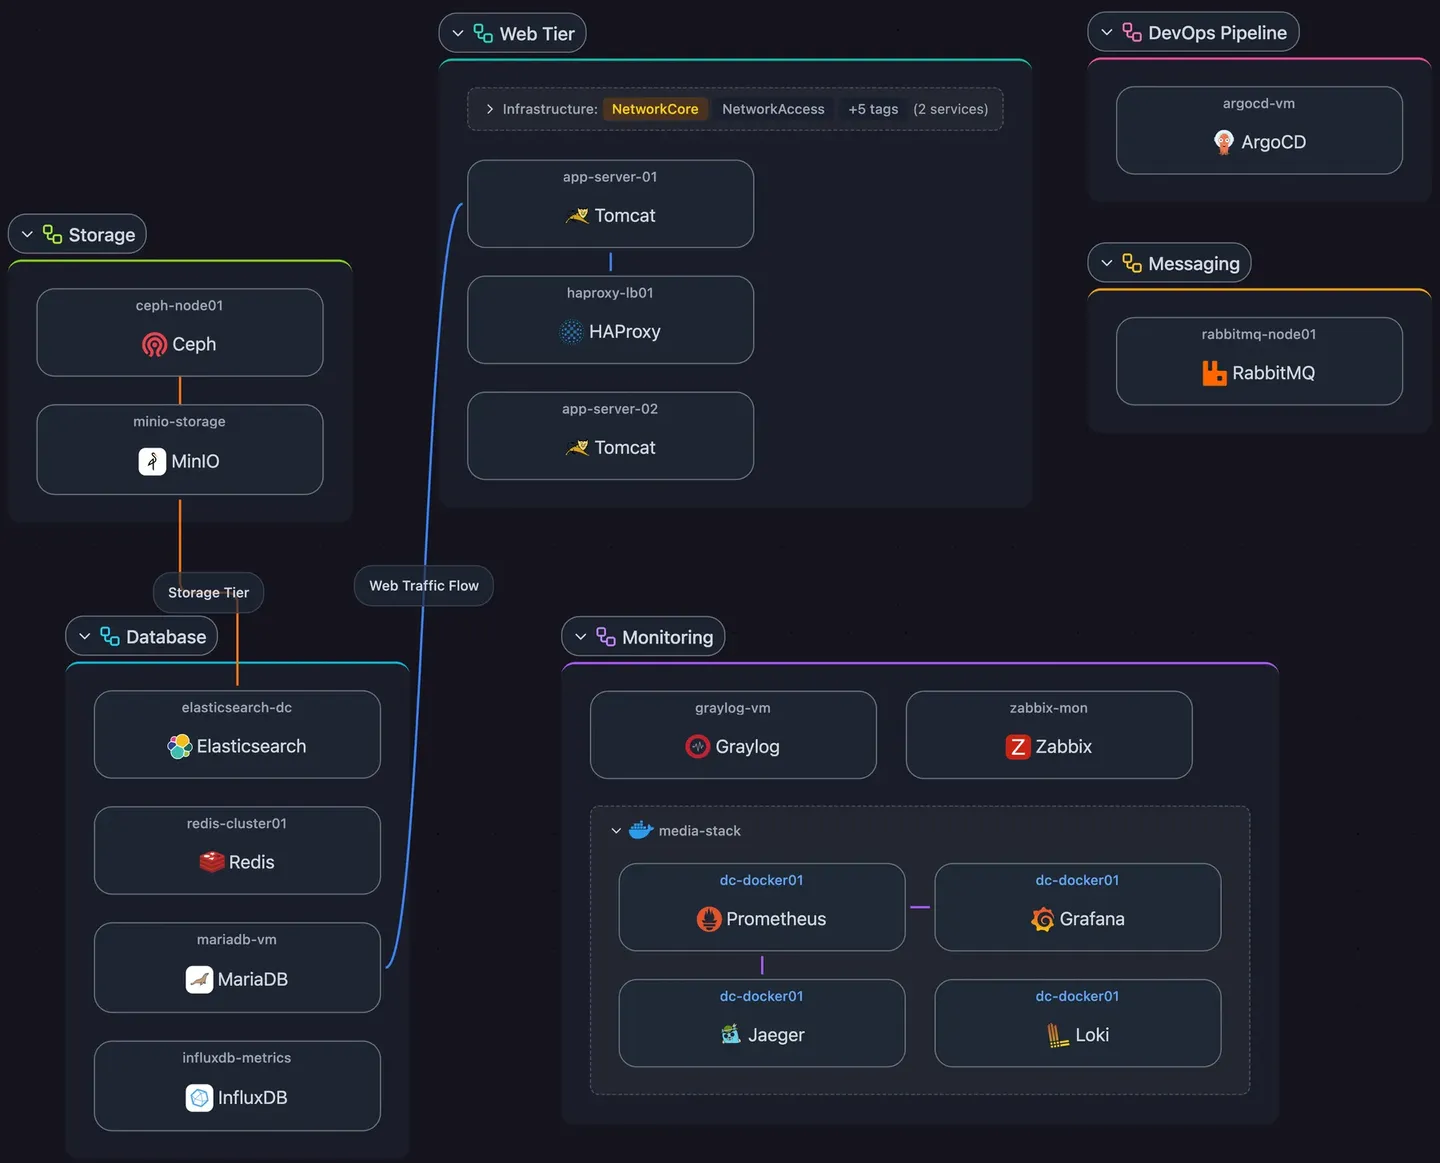
Application groups are tags in the built-in Application tag group. A service joins a group through its own tag or by inheriting its host's tag. Services that don't belong to any application group are collected in an Ungrouped container.
Dependencies
Dependencies are connections you create between services to record relationships discovery doesn't detect, such as the chain a request travels through your stack.
- Request Path: An ordered chain showing how requests flow through services, for example
Internet → Reverse Proxy → App Server → Database. Use it for request routing, data pipelines, and backup chains. - Hub and Spoke: A central service with multiple dependents. Use it when several services connect to a shared resource like a database, DNS server, or message queue.
To create one, select multiple elements in the topology and create a dependency from the selection.
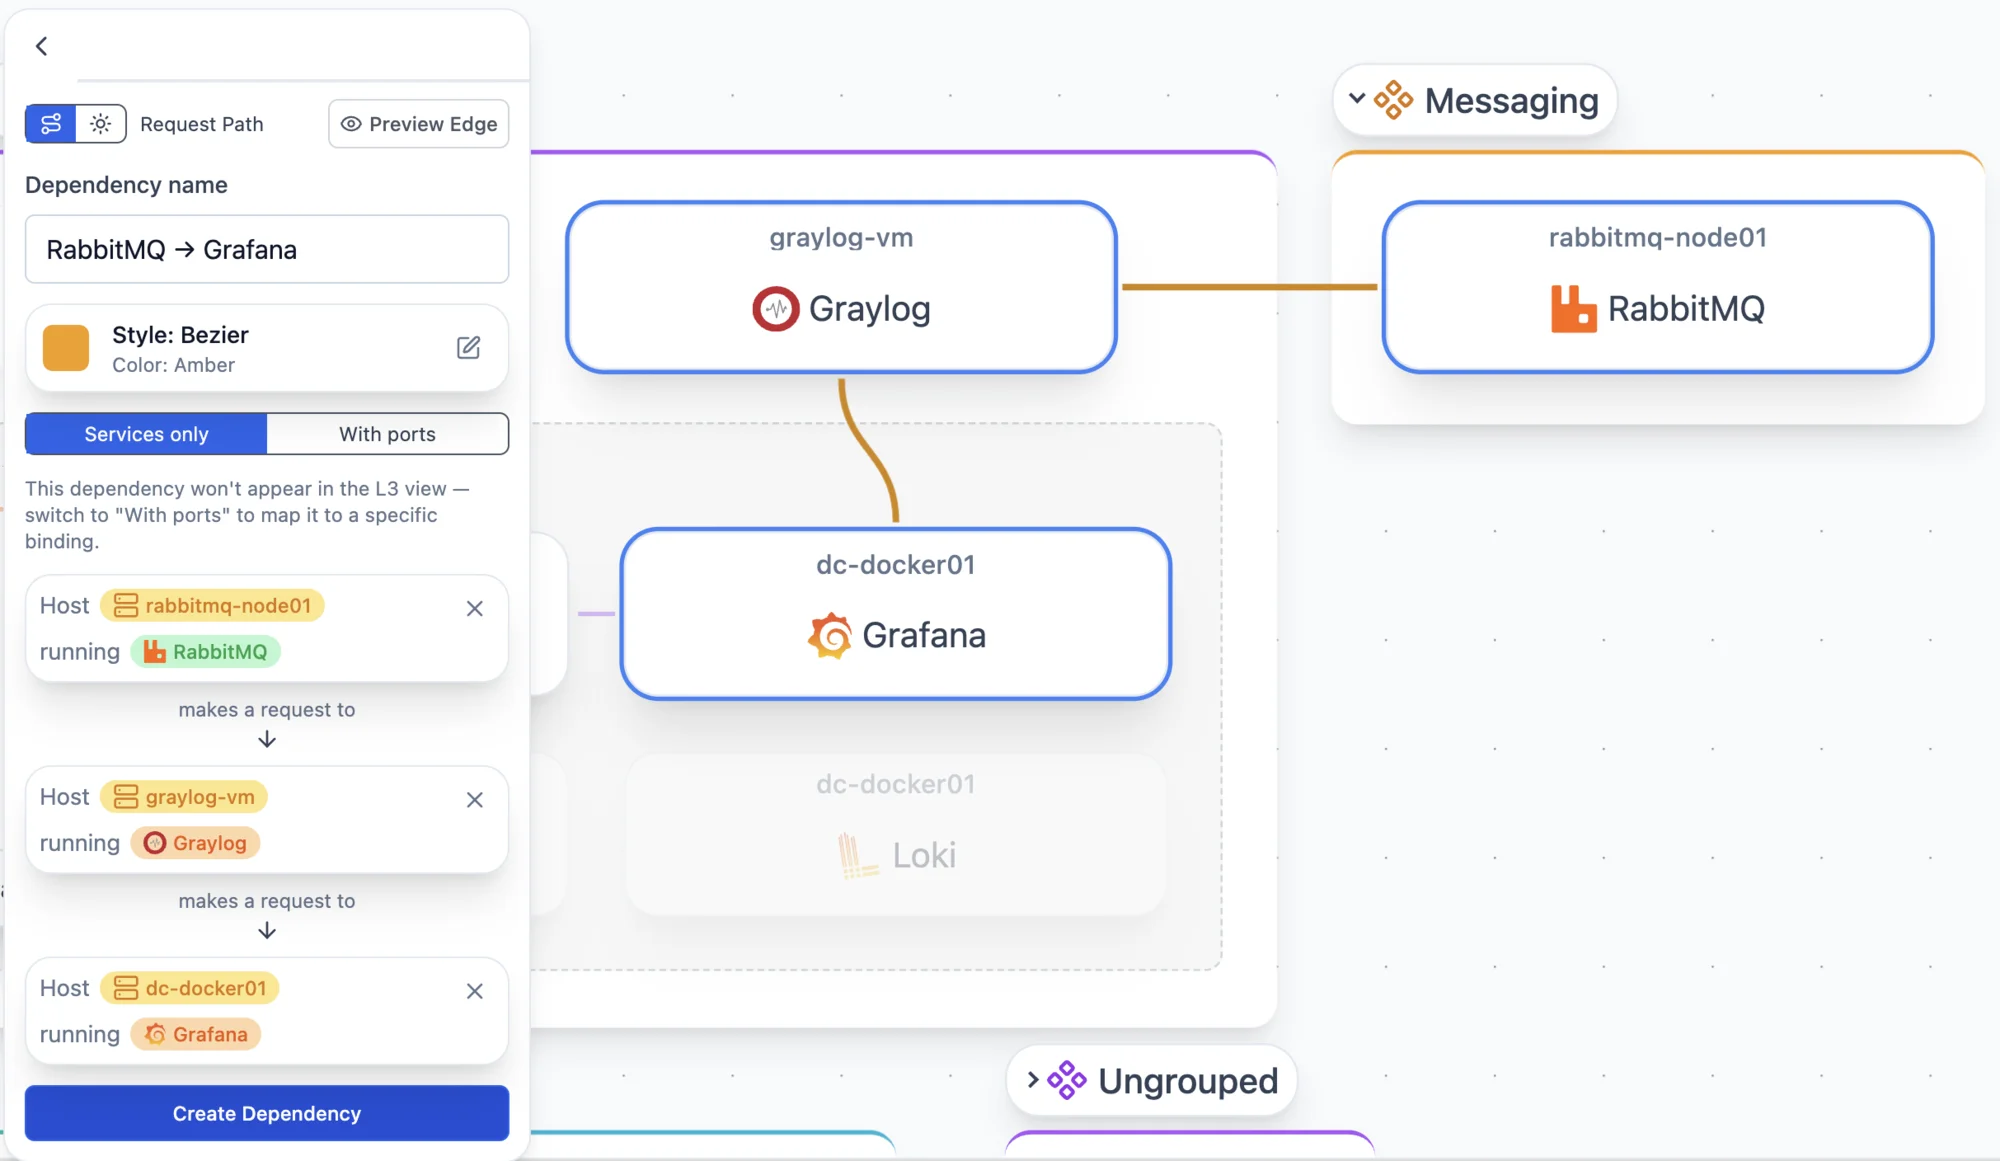
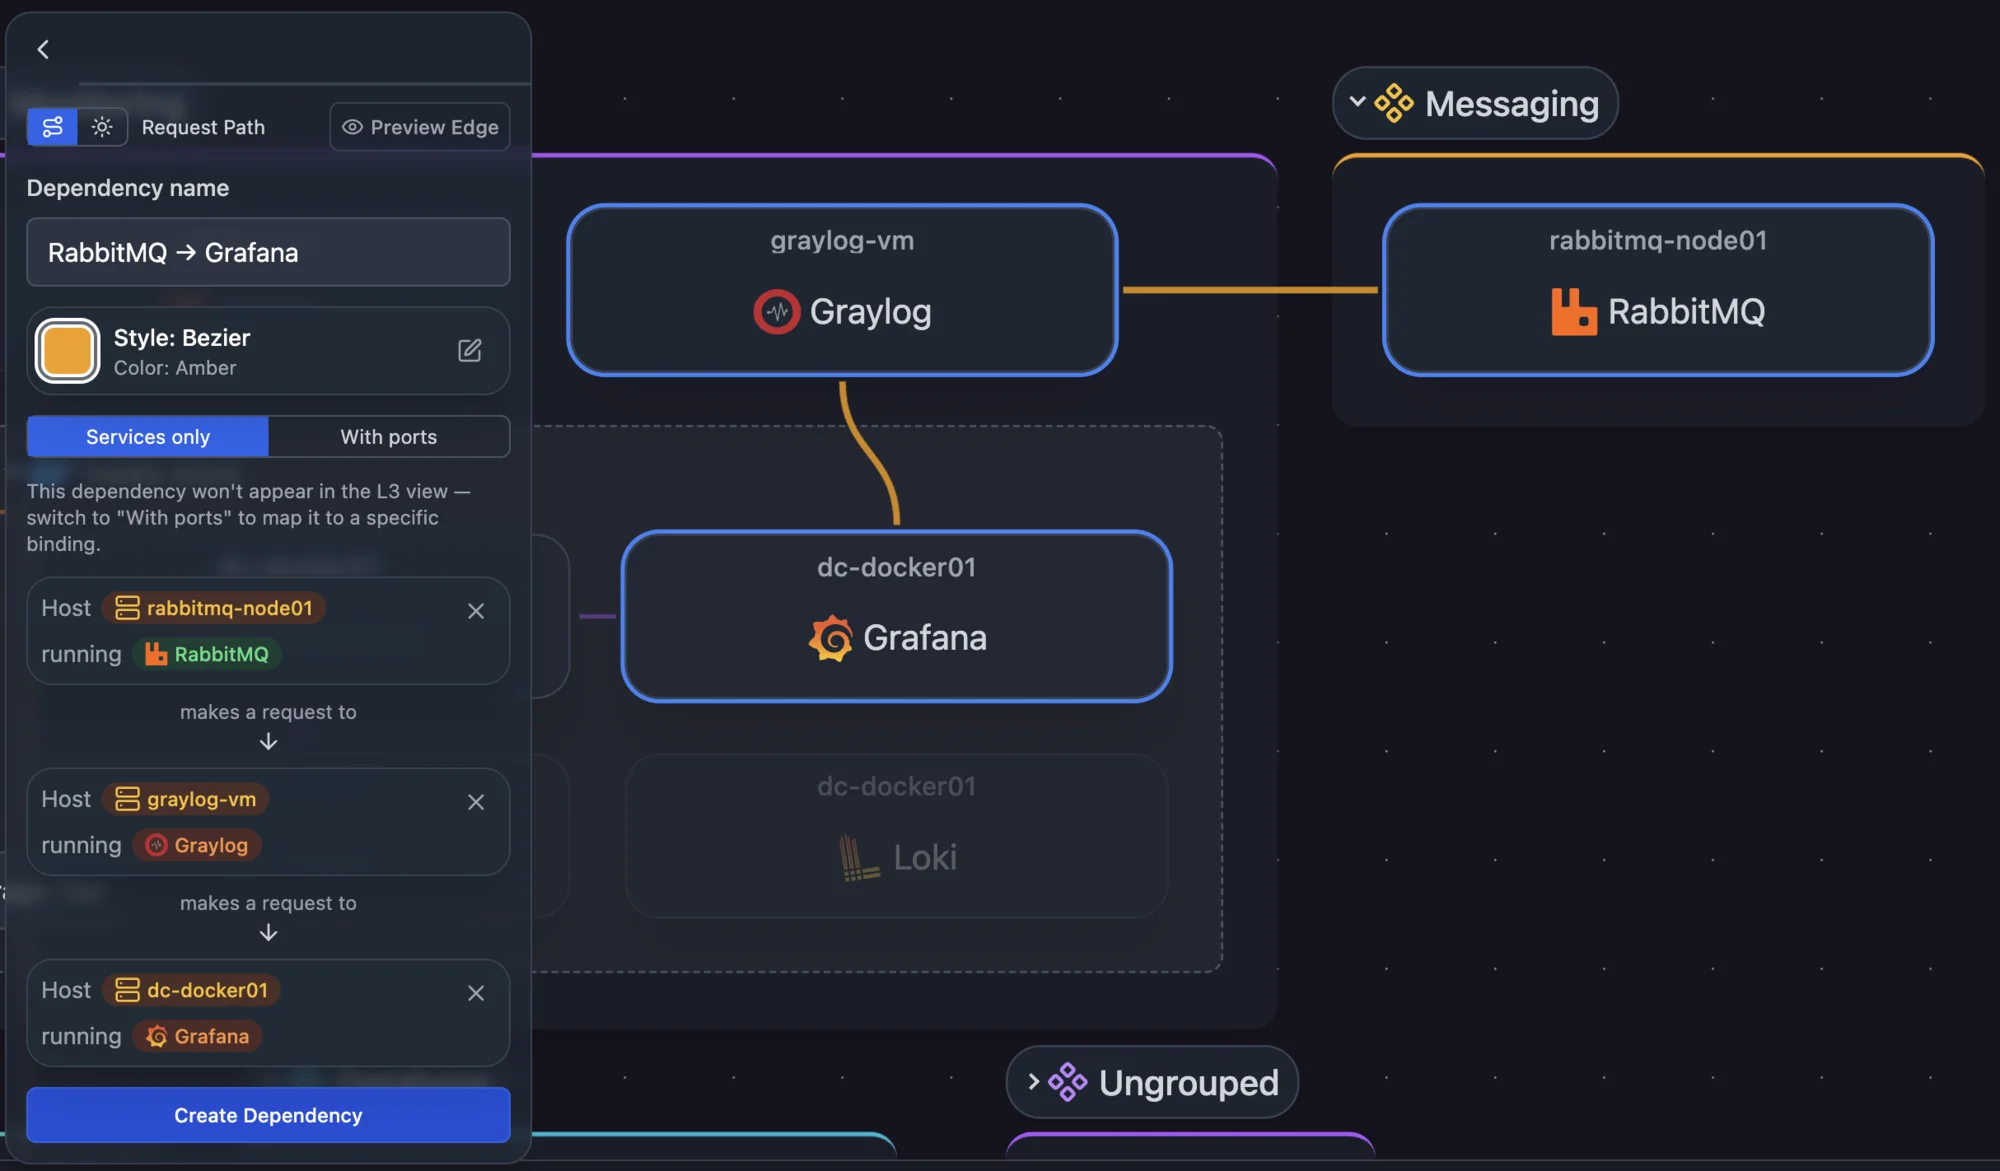
Dependencies are the connections in the Application perspective. Dependencies configured with port-level detail also appear as overlays in L3 Logical. L2 Physical and Workloads don't show them.
Customizing views
Each perspective can be customized with grouping rules, sort order, and filters.
Grouping rules
Set grouping rules in the Layout tab of the options panel. Each perspective has container rules, which define its top-level containers, and a customizable set of element rules that organize nodes within those containers.
Container rules define what the main containers are. Rules marked optional can be removed:
| Rule | What it groups | Applies to |
|---|---|---|
| Subnet | Group entities by subnet | L3 Logical |
| Container Bridges (optional) | Merge a host's container runtime bridge subnets into a single group (e.g., Docker bridge networks). This prevents clutter from multiple bridge subnets on the same host. | L3 Logical |
| Application | Group services by application tag | Applications |
| Host | Group entities by host | L2 Physical, Workloads |
Element rules organize nodes within each container into sub-groups. Each rule applies to specific perspectives:
| Rule | What it groups | Applies to |
|---|---|---|
| Service Category | Group services by category | Applications, Workloads |
| Tag | Group entities by tag | All perspectives |
| Hypervisor | Group VMs by hypervisor | Workloads |
| Container Runtime | Group containers by runtime | Workloads |
| Stack | Group containers deployed together as a stack (e.g., Docker Compose, Podman Compose) | L3 Logical, Applications |
| Trunk Ports | Group trunk ports (ports carrying multiple VLANs) | L2 Physical |
| VLAN | Group access ports by native VLAN ID | L2 Physical |
| Port Status | Group ports by operational status | L2 Physical |
Sort order
Sort by, at the top of the Layout tab, sets the order of the items inside each top-level container, including the groups within it. The top-level containers keep their placement.
Every sort except Automatic reads left to right, top to bottom. A group sorts by the lowest value among its members, so on L3 Logical a group sits where its lowest address would, whether it is expanded or collapsed. Items with nothing to sort by, such as a node with no address, go last.
Under a sort other than Automatic, connected items inside a container are no longer pulled next to each other.
Edge filtering
Each perspective shows its own connection types, some by default and some as overlays you toggle on. On L3 Logical, for example, Same Container and Container Runtime are overlays (see Container networks on L3).
Metadata filtering
Some perspectives offer metadata filter groups that fade everything except the elements you select. The By staleness group (Current / Stale) narrows the view to entities discovery hasn't seen within their site's window; see Staleness. Other groups include service category and, on Workloads, virtualization type. A filter group only appears when the entities in view differ on that dimension.
Tag filtering
The Filters tab of the topology options hides hosts, services, subnets and other entities that carry a tag you pick. Each perspective keeps its own tag filter, saved with the topology, so hiding a tag on L2 Physical leaves L3 Logical unchanged. Tags in the Visibility group show as always applied and can't be turned off here, since they hide what they're on from every topology.
Layout and detail
Scanopy positions every node and connection. To change how much detail the map shows, use the expand/collapse control at the top right, or press ] and [, to step the whole diagram between fully expanded and fully collapsed.
Refining your topology
After initial discovery, two refinements make every perspective more accurate:
- Assign unclaimed ports. Open a host and use Unclaimed Open Ports on its Services tab to assign detected ports to the services listening on them. See Unclaimed Open Ports.
- Consolidate multi-NIC hosts. Hosts detected across multiple VLANs can be merged into a single logical host. See Consolidating Duplicate Hosts.
Snapshots
The Live view reflects your current discovery data: as scans add, change, or remove entities, the topology updates to match. On a large site, the Live view keeps its layout while a scan runs and shows a Refresh button to apply the changes so far. It updates on its own when the scan ends.
A snapshot is a read-only, point-in-time copy of a site's topology: its hosts, services, ports, interfaces, subnets, VLANs, and tags as they were when you captured it. Use it to see what your network looked like before a change, a migration, or an incident.
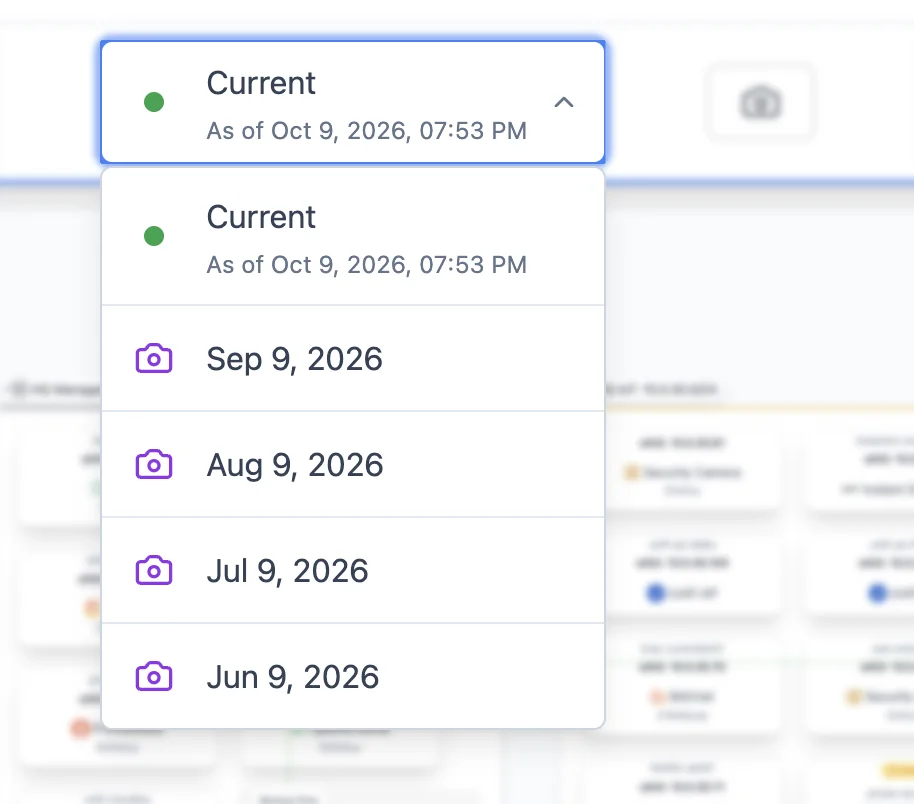
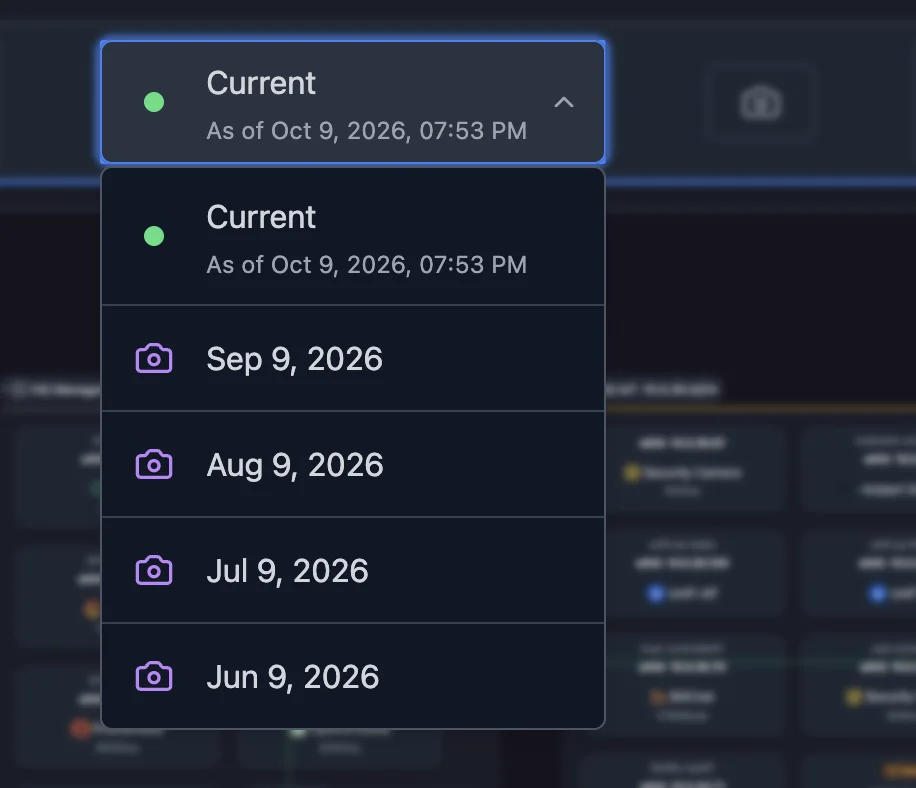
- Take one: click Take Snapshot in the topology toolbar. Snapshots are captured manually, never on a schedule.
- View one: use the snapshot selector in the toolbar to switch between Live and any saved snapshot. In a snapshot you can inspect details, filter by tags, switch perspectives, pan, zoom, and export. Tagging, dependency editing, grouping changes, and taking new snapshots are only available on the Live view.
- Delete one: select the snapshot and choose Delete Snapshot. Your live topology and other snapshots are unaffected.
Snapshots are available on paid plans, and each plan keeps snapshots for a set retention window. Older snapshots are pruned automatically. See pricing for which plans include snapshots and how long each retains them.
Self-hosted deployments can override the retention window with the SCANOPY_SNAPSHOT_RETENTION_DAYS_OVERRIDE environment variable. See Server Configuration.
Exporting
Click Export to download the current view as it's drawn, with your filters, collapsed containers and layout intact. PNG, SVG, PDF and HTML give you a picture for a report. draw.io and Visio (.vsdx) give you an editable diagram: every container, card and connection is a native shape you can rearrange, restyle or annotate, so you can finish a network diagram for a customer handover or an audit without redrawing it. Mermaid and Confluence give you wiki markup. Which formats are available depends on your plan.