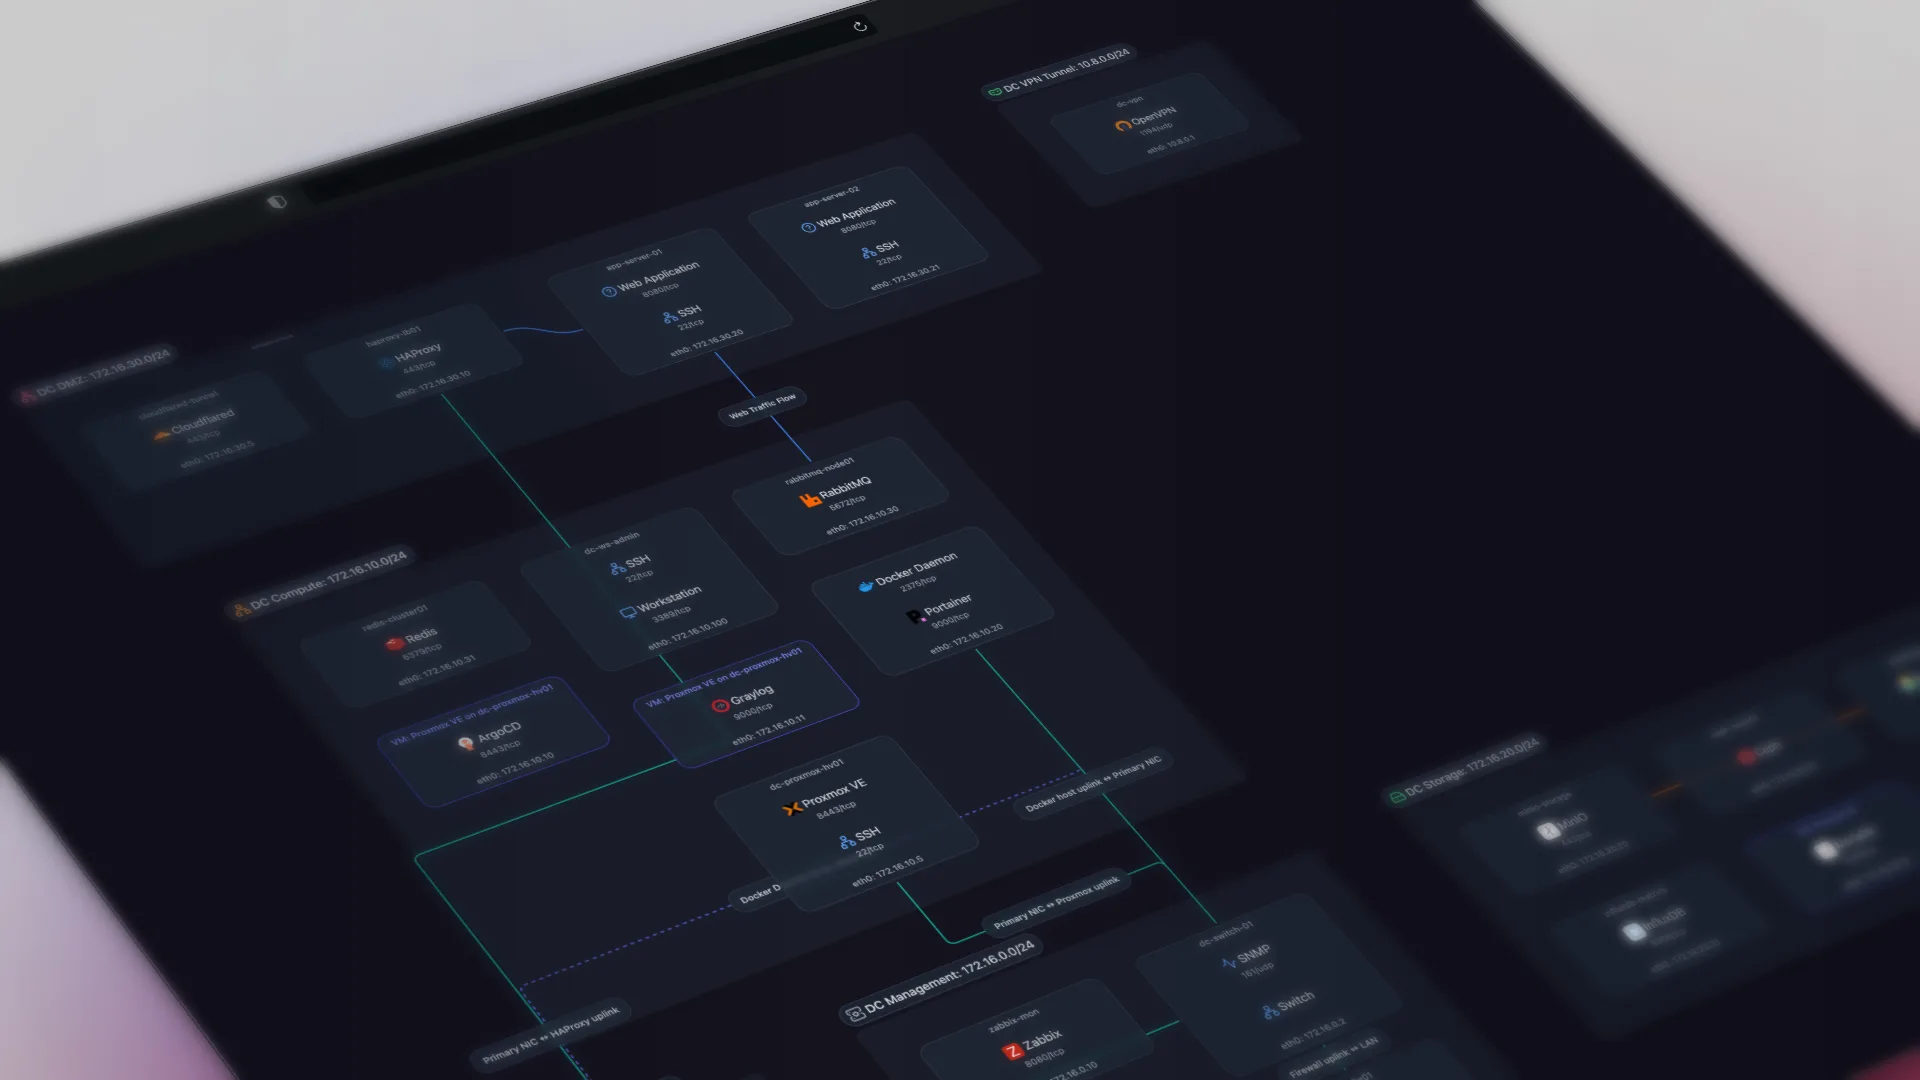
TL;DR: Podman tools show you containers one host at a time, and pods make it worse: the app containers share the pod's network namespace and report nothing of their own. Scanopy discovers Podman containers, resolves pod members, and nests them under the host they run on, in the same topology map as the rest of your network.
Podman makes it easy to lose track of where things actually run. podman ps tells you what is running on the host you happen to be SSHed into. Podman Desktop or Cockpit gives you a clean dashboard, one environment at a time. Neither one answers the question I keep hitting in my own homelab: which host is this container on, what subnet can reach it, and what does it talk to.
That last question is a network question, and container tools are not built for it. This is about seeing your containers as part of your network, not as a list sitting on top of it. And with Podman, pods make the per-host view even less useful.
Podman Tooling Is Scoped to One Host. Your Network Spans Many.
A container is an IP and a set of ports, like anything else on your network. But the tooling around Podman is organized by host: you look at one machine's containers, then another machine's containers, and you stitch the picture together in your head. The moment you are debugging "why can't service A reach service B," that per-host view is the wrong altitude. What that question needs is the container's position on its network, the host it runs on, the database it depends on, and the switch the whole thing hangs off.
Podman already reports what containers exist. What it does not report is where they sit on your network and what is around them.
What Scanopy Pulls From Podman
When the Scanopy daemon has access to the Podman API (via socket or TLS proxy), it reads each host's containers as part of its normal scan and collects:
- the image each container runs
- its published ports
- the networks it is attached to
- its labels
Podman exposes a Docker-compatible API, so this is the same data Scanopy already reads from Docker, gathered in the same pass that discovers the rest of your network over SNMP, LLDP, CDP, and ARP (here is how that automated discovery works). Your Podman containers are not a separate inventory you have to reconcile. They land in the same topology as your switches, VMs, and bare-metal hosts, right alongside any Docker containers you also run.
A Pod's App Containers Report No Network of Their Own
Plain Podman containers behave like Docker containers, and Scanopy treats them the same way. Pods do not.
A pod is Podman's version of the Kubernetes pod: a group of containers that share one network namespace. That namespace belongs to the pod's infra container (the small pause-style container that holds the pod together), and it changes two things about what the API reports:
- The API reports the pod's published ports on the infra container. When you list containers, the pod's published ports appear on the infra container, not on the app container that is actually listening. Match services to ports naively and the infra container is drawn as a service. Scanopy scopes the infra container to no ports of its own, so it stays a distinct piece of plumbing on the map instead of being drawn in place of the service that actually listens.
- The app containers have no network of their own. Every non-infra container in a pod runs with its network mode set to the infra container, shares that namespace, and reports no networks or interfaces itself. A tool that enumerates each container's own networking finds nothing and drops them. Scanopy follows that shared-namespace reference back to the infra container and inherits its interfaces, so the pod's members (your nginx, your Grafana) still land on the map.
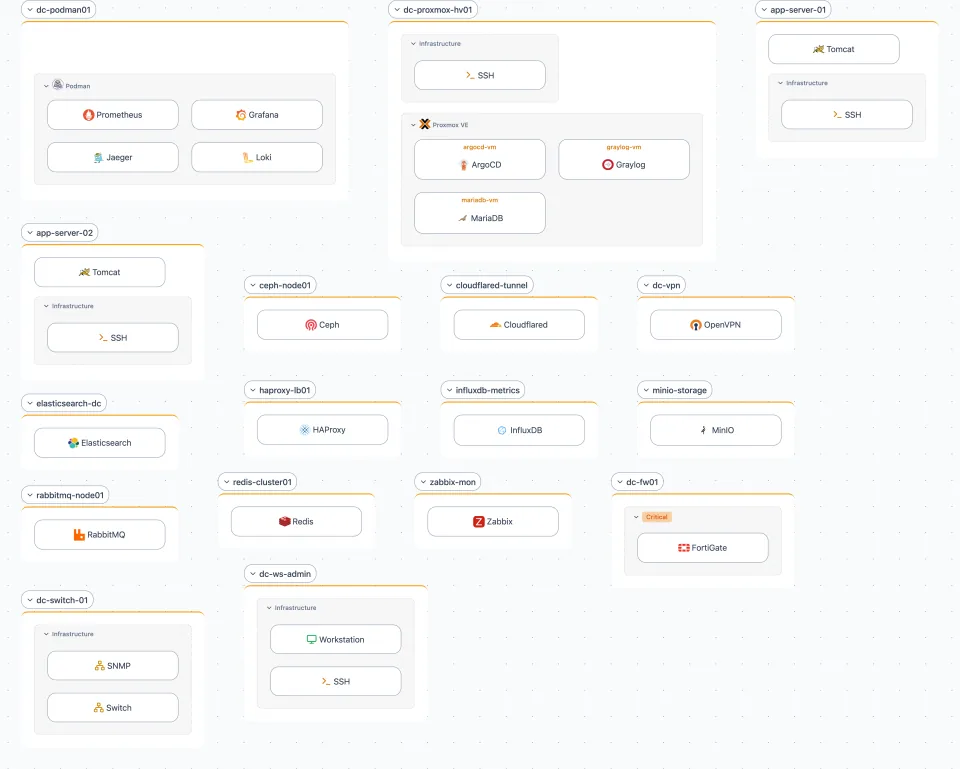
A pod therefore renders as one stack: its members grouped under the host, with the infra container drawn as the shared plumbing rather than as an app.
The Workloads View Nests Containers From Bare Metal to Hypervisor to VM
Scanopy produces four views from a single scan. The one built for this is the Workloads view, which shows the full nesting chain: bare metal, to hypervisor, to VM, to container.
So a Postgres container shows up nested under the Podman host it runs on, which might itself be a VM on a Proxmox node, which is a physical box plugged into a switch port. You see the whole stack in one place, without holding the layers in your head or guessing which physical machine actually runs a container.
The L3 View Draws Each Container on Its Subnet
Containers are not stuck in that one view. They also appear in the L3 (logical) view, where a Podman stack is drawn alongside the subnet it sits on. That shows the network each container communicates over, not just the host it runs on.
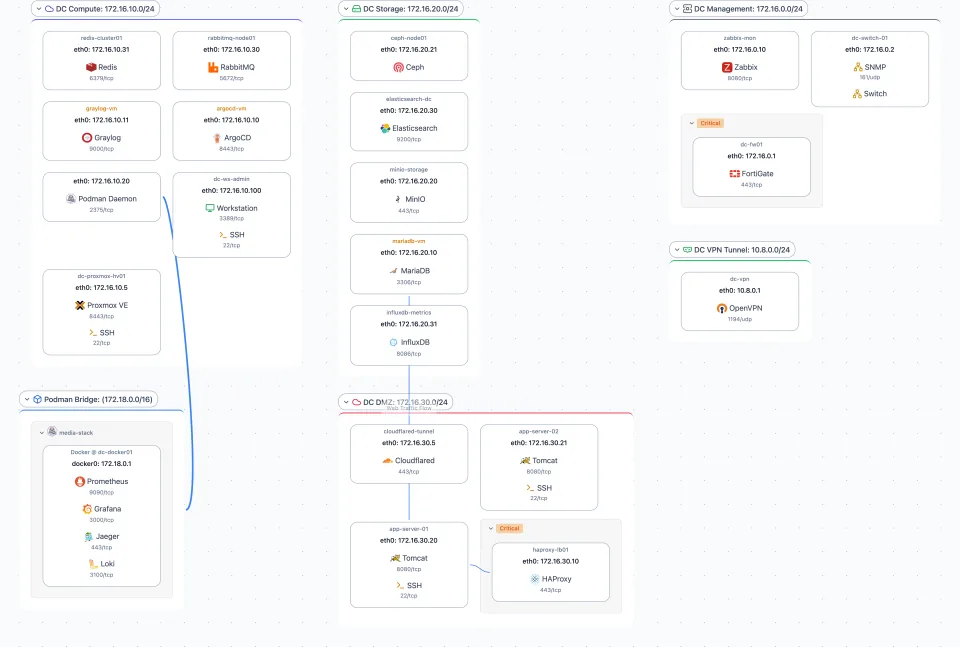
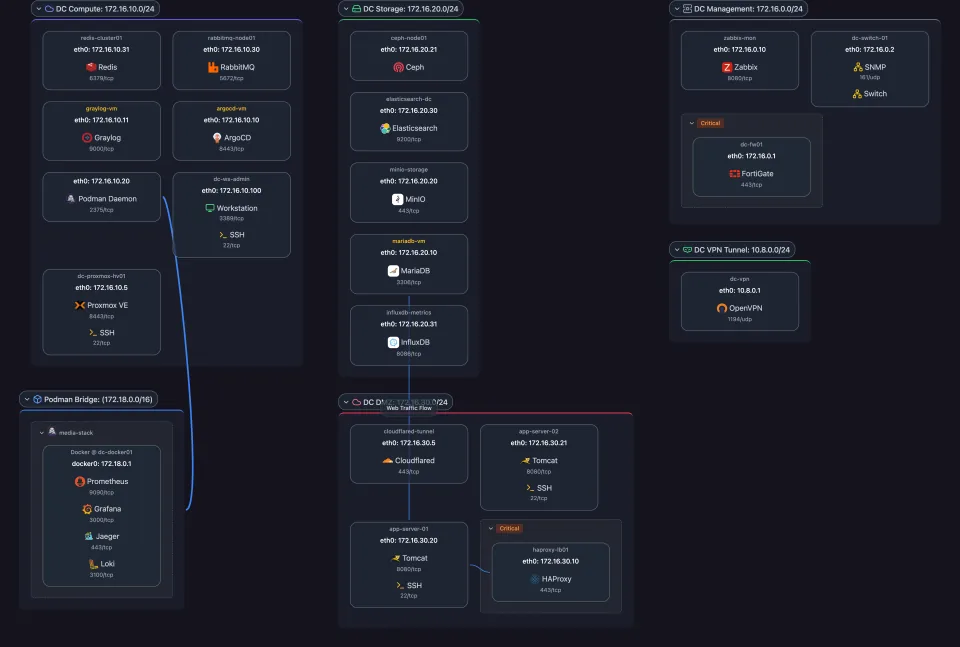
Because the map redraws on every scan, a container that moves to a different host, or one that appears or disappears, is reflected automatically. The view stays current without anyone updating a diagram.
Setting It Up
Scanopy discovers Podman over the same two transports as Docker: a local socket on the daemon's own host, or a proxy for a host the daemon does not run on. You turn Podman on from the integrations grid and point it at one of them.
For the local socket, Scanopy resolves the Podman socket path for both rootful (/run/podman/podman.sock) and rootless ($XDG_RUNTIME_DIR/podman/podman.sock) setups, honoring CONTAINER_HOST if you have it set. One daemon covers the whole host.
To lock down what the daemon can touch, or to discover containers on a remote host, run a Podman socket proxy with read-only access, restrict it to the handful of API calls Scanopy needs (list and inspect containers, list networks), and add a Podman Proxy credential pointing at it. Because Podman exposes a Docker-compatible API, a mixed homelab of Podman on one host and Docker or VMs on others shows up as one coherent map rather than several disconnected ones.
Scanopy Does Not Manage or Deploy Containers
Scanopy is not a container manager. It will not start, stop, or deploy anything, and it is not trying to replace Podman Desktop, Cockpit, or your Quadlet and systemd setup. Those tools manage containers. Scanopy shows you where your containers sit on the network and what they connect to. They work well side by side: manage in your Podman tooling, see the topology in Scanopy.
If you are mapping the rest of your gear too, the same scan that finds your Podman containers also walks your switches and routers over SNMP. Here is the deeper version of that: exploring your network topology with SNMP. Running Docker as well? The same discovery covers it: visualizing Docker containers on your network. And Scanopy fingerprints the services running on each host, so a host is not just an IP, it is "the box running Postgres, Nginx, and twelve containers."
Frequently Asked Questions
How do I see which host a Podman container runs on across my network?
Use a tool that discovers containers as part of a network scan rather than per host. Scanopy reads each host's Podman API during its normal scan and places every container under the host it runs on, in the Workloads view. That view shows the full chain from bare metal to hypervisor to VM to container, so you can see exactly which physical machine runs a given container.
What does Scanopy pull from Podman?
When the daemon has access to the Podman API over a socket or TLS proxy, it reads each container's image, its published ports, the networks it is attached to, and its labels. Podman exposes a Docker-compatible API, so this is the same data set Scanopy collects from Docker, gathered in the same pass that discovers the rest of the network over SNMP, LLDP, CDP, and ARP.
How does Scanopy handle Podman pods?
A pod's containers share one network namespace owned by the pod's infra container, so the app containers (nginx, Grafana, and so on) report no networks of their own and the infra container reports the pod's published ports. Scanopy resolves this. It follows each member's shared-namespace reference back to the infra container so pod members still land on the map, keeps the infra container as its own distinct box, and groups the pod as a single stack in the Workloads view.
How is this different from podman ps or Podman Desktop?
Podman ps and Podman Desktop show containers one host or environment at a time, organized by machine. They answer what is running, not where it sits on the network or what it connects to. Scanopy draws each container on its network, under the host it runs on and alongside the subnet and services around it, which is the view you need when debugging why one service cannot reach another.
Can Scanopy discover containers on remote or rootless Podman hosts?
Yes. Scanopy resolves the Podman socket path for both rootful and rootless setups, honoring CONTAINER_HOST. To reach a host the daemon does not run on, run a Podman socket proxy there with read-only access, restrict it to the calls Scanopy needs (list and inspect containers, list networks), and add a Podman Proxy credential. A mixed setup of Podman on one host and VMs or Docker on others then shows up as one coherent map.
Does Scanopy manage or deploy Podman containers?
No. Scanopy is a documentation tool, not a container manager. It will not start, stop, or deploy anything and is not trying to replace Podman Desktop, Cockpit, or your Quadlet and systemd setup. It shows where your containers sit on the network and what they connect to. The two work well side by side: manage containers in your Podman tooling, see the topology in Scanopy.
Started as a homelabber, now deep in SNMP MIBs, Layer 3 topology, and service fingerprinting - building the network documentation tool I wished existed.