TL;DR: Automated network documentation uses protocols like SNMP, LLDP, and ARP to discover devices, map connections, and keep records current without manual effort. It replaces spreadsheets and stale Visio files with live, always-accurate diagrams.
Ask an IT team how they document their network and you'll get one of three answers: a spreadsheet that's six months old, a Visio file from a person who no longer works here, or "we don't."
This isn't a surprise. Manual documentation fails because networks change constantly and humans don't update diagrams after every change. The person who knows the network doesn't need the diagram. It exists for everyone else - and the incentive to maintain it is zero.
Automated network documentation solves this by taking humans out of the loop. Software discovers what's on your network, maps how it's connected, and keeps that record current on a schedule. No discipline required. No Friday afternoon Visio sessions.
What Network Documentation Actually Includes
Before getting into automation, it's worth being specific about what "network documentation" means:
- Device inventory: every host on the network: IP addresses, MAC addresses, hostnames, vendor identification
- Services: what's running on each host: databases, web servers, DNS, Docker containers, printers
- Connections: how devices connect to each other: physical links, logical paths, switch port mappings
- Network interfaces: port numbers, speeds, admin/operational status
- Device details: system descriptions, uptime, serial numbers, hardware models
Most teams attempt some version of this. Few keep it current. A network documentation template is a reasonable starting point, but the moment you save it, it starts decaying.
What Makes Documentation "Automated"
Automated network documentation differs from manual documentation in three ways:
Discovery-based, not human-entered. Instead of someone typing device details into a spreadsheet, a scanner queries the network directly. It uses protocols your devices already speak:
- SNMP -- pulls device details, interface status, and system information from managed switches, routers, and servers
- LLDP and CDP -- reveal physical connections between devices. Your switches already broadcast this data; a scanner just listens
- ARP tables and MAC forwarding tables -- map IP-to-MAC relationships and trace which devices connect through which switch ports
None of this requires installing agents on endpoints. A single scanner on the network can reach everything these protocols expose.
Continuous, not point-in-time. A manual diagram captures the network at one moment. Automated documentation rescans on a schedule - daily, hourly, whatever you set. Devices that appear, disappear, or change get reflected automatically.
Living output, not a static file. The result is an interactive topology map, not a PNG or a Visio file. You can click a host to see its services, filter by subnet, search by hostname, and switch between four views of the same scan: physical (L2), logical (L3), workloads (host to hypervisor to container), and applications. And because it updates itself, the map you look at during a 2am outage matches reality.
How Automated Discovery Works, Step by Step
The protocols above sound abstract until you see how they fit together. Here's what actually happens when an automated documentation tool scans your network:
Step 1: Find live hosts. The scanner sends ARP requests across your subnets. Every device that responds reveals its IP address and MAC address. This is fast (a /24 subnet takes seconds) and catches everything from servers to printers to IoT devices that don't respond to ping.
Step 2: Identify what each host is. For each live IP, the scanner runs service detection: port scans identify what's listening (HTTP on 443, SSH on 22, PostgreSQL on 5432), and SNMP queries pull system descriptions, hardware models, and serial numbers from devices that support it.
Step 3: Map connections between devices. This is where topology comes from. The scanner reads LLDP and CDP neighbor tables from switches and routers. These tables contain exactly what's connected to each port and what's on the other end. For devices that don't speak LLDP/CDP, ARP tables and MAC forwarding tables fill the gaps by tracing which MAC addresses are reachable through which switch ports.
Step 4: Build the topology. The scanner correlates all of this: host A's MAC address appears in switch B's forwarding table on port 3, and switch B's LLDP table says port 24 connects to router C. The result is a model of what's connected to what, built from the network's own data and rendered as four views you switch between, not one flattened map.
Step 5: Repeat on schedule. The scanner reruns automatically (daily, hourly, or on demand). New devices appear on the map. Removed devices disappear. Changed connections update, and snapshots version each scan so you can see exactly what changed between two points in time. No human intervention required.
The entire process is agentless. Nothing gets installed on the devices being documented. A single lightweight daemon on one machine in the network handles everything.
What Automated Discovery Actually Finds
This is easier to show than describe. Deploy a scanner on your network, run a discovery, and within minutes you get:
| What | How | Example |
|---|---|---|
| Hosts | ARP scanning, ICMP | 192.168.1.30 -- nas01 (Synology) |
| Services per host | Port scanning + fingerprinting | PostgreSQL, Nginx, Pi-hole, Docker (12 containers) |
| Connections | LLDP, CDP, ARP, MAC tables | nas01 → port 8 on switch02 → port 1 on core-sw |
| Interface details | SNMP | GigabitEthernet0/8: up, 1Gbps, full duplex |
| Device metadata | SNMP | Cisco C9200L, uptime 142 days, IOS-XE 17.9 |
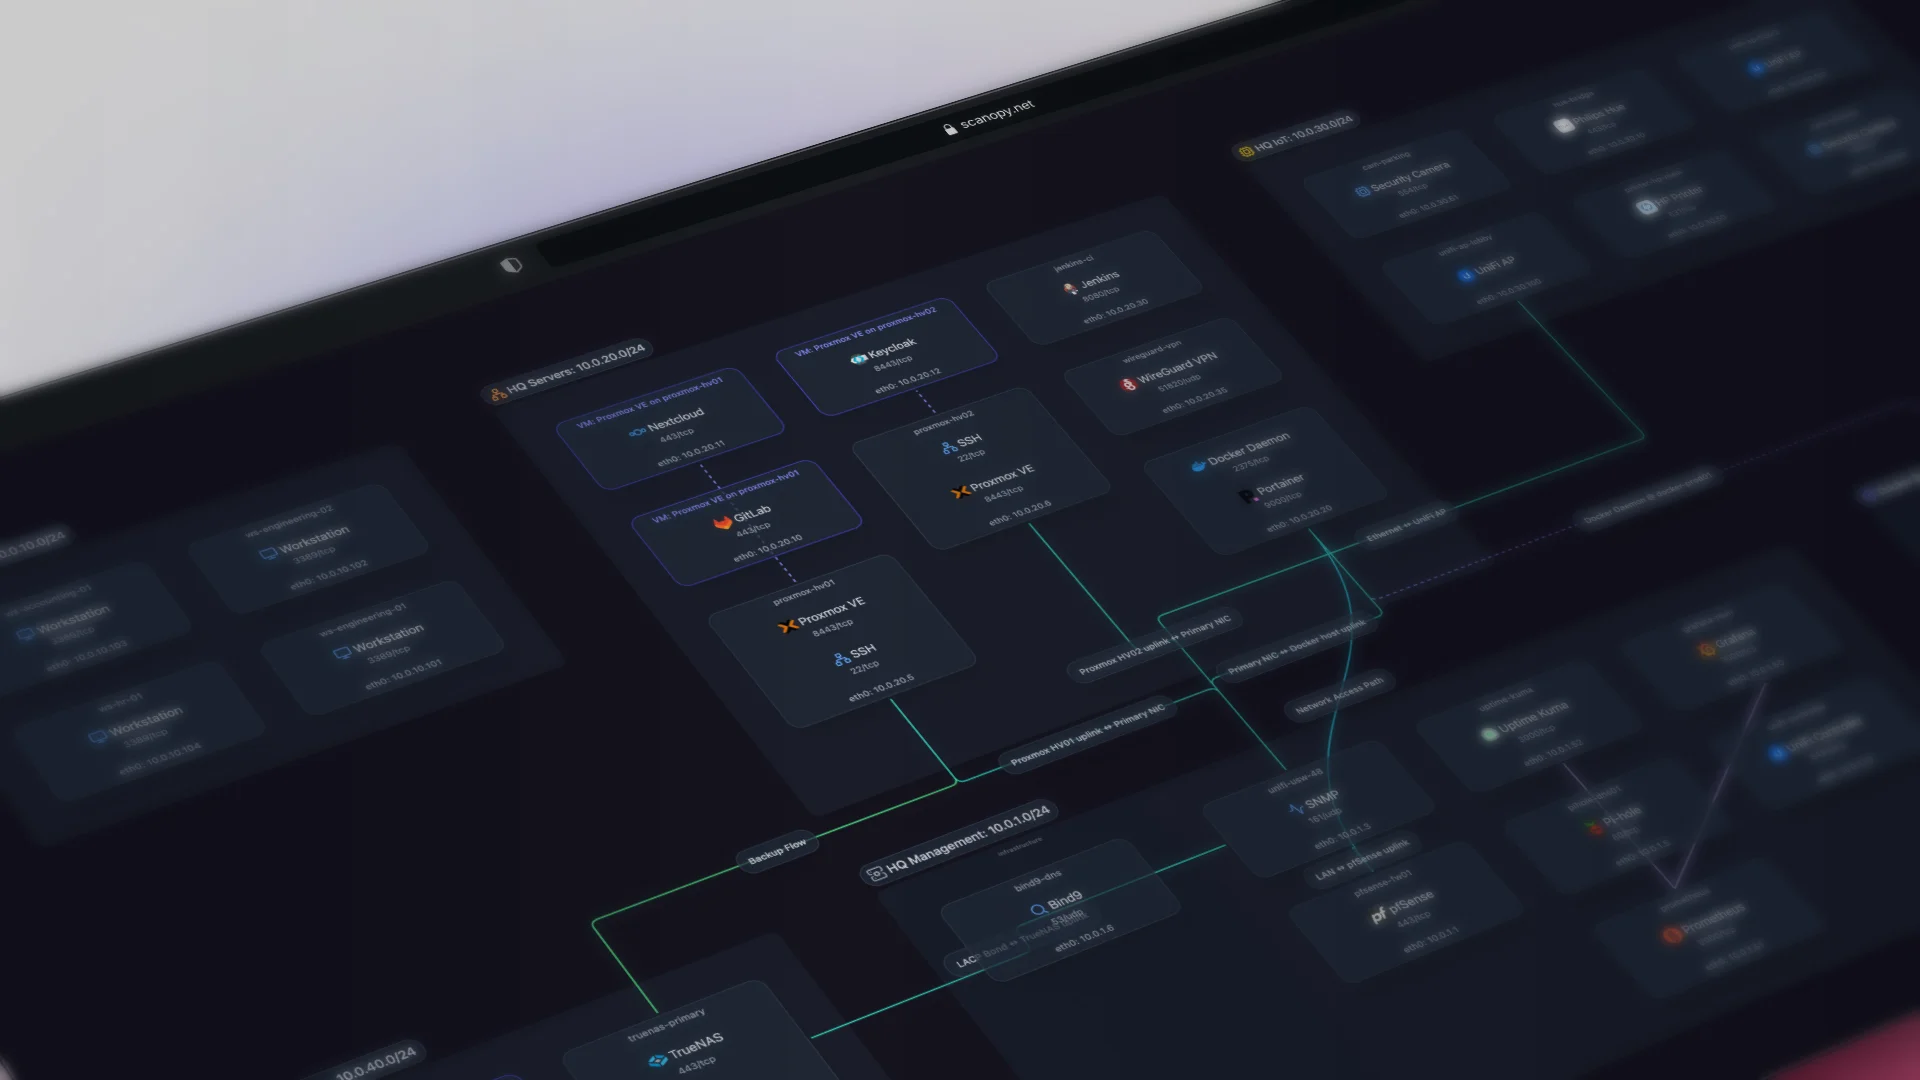
The result is interactive topology views of every device, what it's running, and how it connects to everything else. Scanopy detects over 200 service types automatically -- from enterprise databases to Docker containers to printers.
Here's what that looks like in practice; this is a live Scanopy map you can interact with:
Why It Matters
Troubleshooting with wrong documentation is worse than no documentation
If your diagram says the database server is on VLAN 10 but it moved to VLAN 20 six months ago, you'll spend the first hour of an outage chasing the wrong path. Average downtime costs exceed $14,000 per minute for midsize businesses. An extra 30 minutes of troubleshooting with a stale diagram isn't a minor inconvenience.
The "hit by a bus" scenario is more common than you think
When the one person who knows the network leaves - quits, gets promoted, goes on leave - undocumented networks become black boxes. On a French sysadmin forum we follow, a junior admin described inheriting a network after the previous admin left, the next two quit, and they were now solo with scattered configs, wrong passwords, and incomplete diagrams. This story shows up in IT communities constantly. Automated documentation means the knowledge lives in the system, not in someone's head.
New hires shouldn't need weeks to understand the network
Onboarding a new engineer or contractor onto an undocumented network means weeks of "ask Bob" and tribal knowledge transfer. A live topology map gives them a complete picture on day one - every host, every connection, every service - without scheduling six walkthroughs.
Auditors want current state, not a Visio file from 2021
Compliance audits require demonstrating what's on your network right now. Automated documentation is always audit-ready because it reflects the last scan, not the last time someone remembered to update a diagram.
Documentation vs. Monitoring vs. Asset Management
These three categories get conflated constantly. They're different tools solving different problems:
| Automated Documentation | Network Monitoring | IT Asset Management | |
|---|---|---|---|
| Primary question | What do I have and how is it connected? | Is it working right now? | What did I buy and where is it? |
| Updates | Auto-discovery on schedule | Real-time alerting | Manual + periodic scans |
| Output | Topology maps, device inventory, connection records | Dashboards, alerts, traffic graphs | Asset registers, license counts, depreciation |
| Examples | Scanopy, NetBox (manual entry) | Auvik, PRTG, LibreNMS, Zabbix | Lansweeper, Device42, Snipe-IT |
| Best for | Documentation, onboarding, DR planning, knowledge sharing | Uptime, performance, active troubleshooting | Procurement, compliance, license management |
The distinction matters because buying the wrong category wastes money and leaves gaps.
If your tool alerts you when a switch goes down, that's monitoring. If it tells you what's connected to that switch so you can assess blast radius during an outage, that's documentation. If it tracks when that switch was purchased and when its warranty expires, that's asset management.
Most teams need all three. The mistake is assuming one tool covers the others. Monitoring tools like Auvik and PRTG show topology views, but those are a byproduct of monitoring data, not a dedicated documentation system. Asset management tools like Lansweeper track what you own, but their network maps are limited to what their agents report, not protocol-level topology. Automated documentation tools focus on one job: knowing what's on your network and how it's connected, kept current without manual effort.
Tools That Automate Network Documentation
Several tools approach automated documentation from different angles. Some are dedicated documentation tools, others bundle mapping into a monitoring or asset management platform:
| Tool | Discovery | Pricing | Best for |
|---|---|---|---|
| Scanopy | SNMP LLDP CDP ARP TCP/UDP | Starts at $11.99 monthly, unlimited hosts | IT teams and MSPs who want a dedicated network diagram automation tool which works alongside their existing monitoring platform |
| Auvik | SNMP CDP LLDP ARP | Per-device (contact sales) | MSPs who need monitoring, alerting, and network maps in one cloud-managed platform |
| Domotz | SNMP ARP ICMP CDP LLDP mDNS NetBIOS | $1.50/device/mo | Cost-conscious MSPs who need monitoring, remote access, and basic network maps at a transparent price |
| ManageEngine OpManager | SNMP CDP LLDP ARP | From $95/yr (10 devices) | Mid-market IT teams that want monitoring and visualization at a lower per-device cost |
| NetDisco | SNMP CDP LLDP ARP | Free | Network teams that want free, open-source Layer 2 topology discovery and device tracking |
For a detailed comparison of these and other tools, see our full comparison of automated network diagram tools.
What to Look for in an Automated Documentation Tool
If you're evaluating tools, our comparison of automated network diagram tools covers specific products, pricing, and trade-offs. Here's what matters at a high level:
- Lightweight deployment: one scanner per network, not an agent on every device. You're solving a complexity problem; don't add more complexity
- Protocol support: SNMP, LLDP, and CDP at minimum. ARP and MAC table scanning for full topology
- Scheduled rescans: one-time discovery is just a fancier manual diagram. Automation means continuous updates
- Shareable output: your whole team should see the map without per-seat licensing
- Export options: SVG, embeddable iframes, integrations with tools you already use
- Transparent pricing: avoid per-device models that scale unpredictably as your network grows
Try Scanopy
Scanopy deploys a lightweight daemon that discovers your network and builds a live topology map in minutes. No per-device fees. No infrastructure to maintain.
Started as a homelabber, now deep in SNMP MIBs, Layer 3 topology, and service fingerprinting - building the network documentation tool I wished existed.