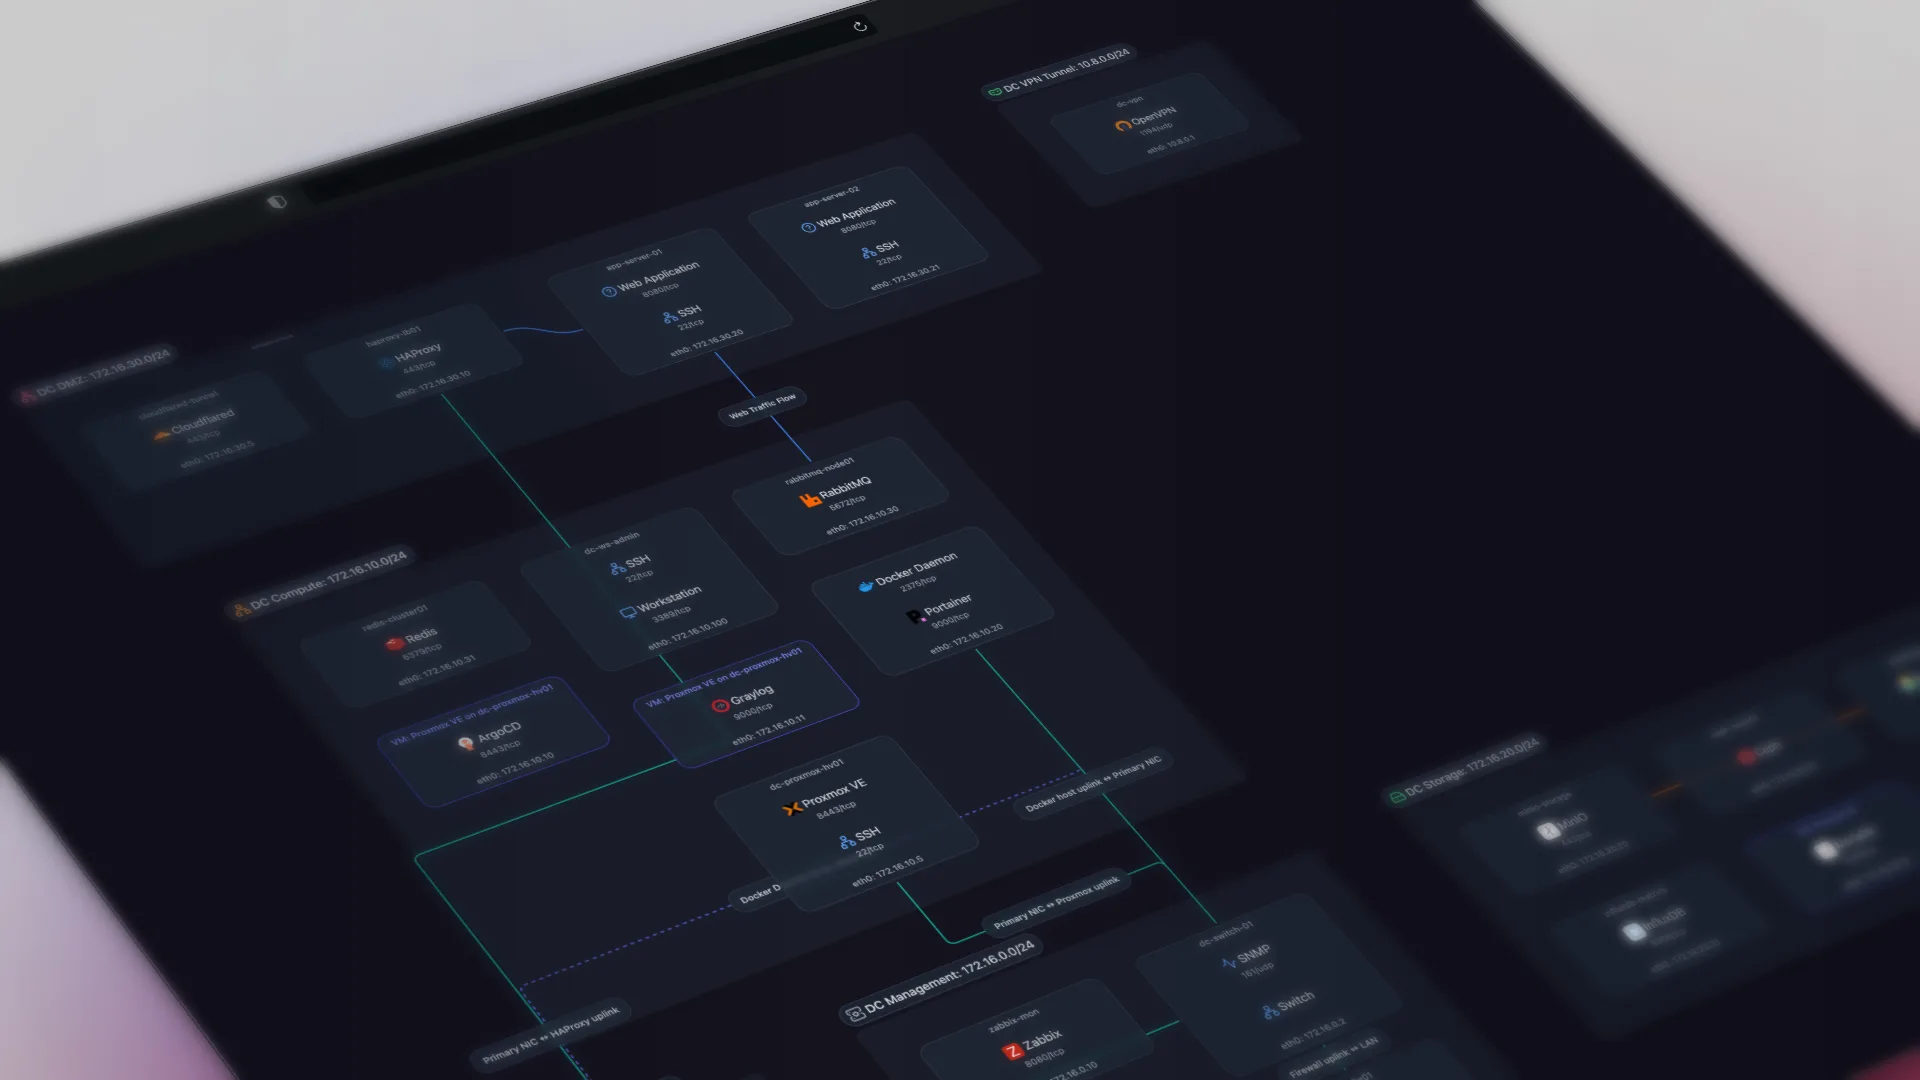
TL;DR: The moment you need to see your network is the moment something breaks, and that is exactly when a spreadsheet of IPs or an old diagram fails you: you can only see one layer, and you can't trust that it's current. Network mapping software discovers the network and draws it as a topology map you can read. The useful insight is that one network is several maps at once (physical cabling, logical routing, workloads, application dependencies), and a good tool lets you switch between them instead of inferring the rest from a single picture. This covers what a map answers, how it gets built automatically, what discovery can and can't see, why the four views matter, and the open-source options.
A link goes down and traffic between two subnets stops. You open the network diagram someone drew a year ago, and it shows you the cabling, which is not the question. The question is routing, and the routing lives on a layer the diagram never captured. So you start over by hand: SSH into a switch, read a MAC table, check an ARP entry, sketch the path on paper. A diagram existed the whole time. It just showed the wrong layer, and it was old enough that you wouldn't have trusted it anyway.
This is what network mapping software is for. It discovers the devices on your network and how they connect, then draws the result as a topology map you can read. The point is not the drawing. It is that you can look at your network instead of holding it in your head, and look at the right layer of it when something breaks or changes.
The questions a network map answers
You don't read a map to admire the topology. You read it to answer a specific question, fast, without grepping through config files or logging into three switches first:
- Where does this host actually connect? Which switch, which port, behind which uplink.
- What sits on this VLAN, and can it reach that one? Segmentation as it is, not as the last person to touch it remembers it.
- What depends on that database? If it goes down, what stops working with it.
A map answers these because of what it captures. Each device is a node carrying its IP and MAC addresses, hostname, and vendor, and the deeper tools fingerprint the services on it, so a node is not just an IP, it is "the box running Postgres, Nginx, and a stack of containers." The links between those nodes are the edges: the physical connections between switches, routers, and hosts, and the logical paths between subnets on top of them. The edges are the part you cannot get from a list at all, and the part a hand-drawn diagram gets wrong first, because cabling and topology change without anyone redrawing them.
How the map gets built automatically
Automatic mapping takes the drawing out of your hands. A scanner queries the network over protocols your devices already implement, then assembles what it finds:
- SNMP reads device details, interfaces, port speeds, and status.
- LLDP and CDP advertise each device's identity to its directly connected neighbors, which is how the physical layout gets built.
- ARP tables and MAC forwarding tables tie hosts to the switch ports they live behind.
The lightweight way to do this is a single scanner that queries the network from one point on it and rescans on a schedule, rather than an agent installed on every host. The map then reflects the current state instead of the day someone drew it. For a closer look at the discovery mechanics, see how automated network documentation works.
Know what discovery can't see
Discovery is only as complete as what your devices advertise, and that is the test to apply to any mapping tool before you trust its picture: ask what it can't see.
A scanner learns the network from protocols like SNMP, LLDP, and CDP, plus ARP tables and active probes such as ping sweeps and port scans. That combination is good at finding what responds and what advertises itself, and blind to the rest. A device that answers nothing shows up as little more than an IP that pings, with no identity; a device that answers nothing at all doesn't appear. An unmanaged switch with no SNMP is the common case: the tool can't see the switch itself, so the hosts connected through it still appear (they answer ARP), but they attach to the managed switch upstream, a hop away from where they actually sit. And discovery reads structure, not intent: it can show that a VLAN exists and what sits on it, but not why it was carved out or what it is meant to keep apart. Scheduled scans have a limit of their own: the map is current as of the last scan, not the last cable change.
None of this is a reason to skip mapping. It is the reason the test matters: these limits come from how discovery works, not from any one product, so no discovery tool escapes them, this category included. Read a map knowing where its blind spots fall and you can troubleshoot from it. Treat it as the whole truth and it will eventually send you down the wrong path with confidence.
One network is several maps: the four views
Physical cabling, IP routing, and application dependencies are different questions, and forcing them onto one diagram produces a tangle that is hard to read. This is why a single topology map fails you mid-incident: you're looking at one layer and reasoning about another. The fix is to treat one network as several maps and look at the layer that answers the question in front of you:
- Physical (L2) shows switches, their ports, and the cabling between them. Reach for it when you are tracing a dead link, finding which switch port a host is actually on, or checking how your uplinks and stacks are laid out.
- Logical (L3) shows subnets, VLANs, and routing. Reach for it when you are planning or auditing segmentation, or answering "can this VLAN actually reach that one," which the physical map cannot tell you.
- Workloads shows hosts with the containers and virtual machines nested inside them. Reach for it when you need to know where a service physically runs, not just that it exists somewhere.
- Applications shows how services depend on each other across hosts. Reach for it when you are assessing blast radius: if this database goes down, what stops working.
Most open-source mappers give you one of these, usually the L2 topology, and leave you to infer the rest. Getting all four from a single scan is the difference between a map you glance at and a map you troubleshoot from. You switch the view instead of guessing the layer.
Why a static diagram fails when you need it most
A diagram in a wiki looks like documentation, and for planning conversations it is fine. The trouble starts the moment you reach for it under pressure, because that is when its three built-in problems surface at once:
- It's as old as the day it was drawn. Every change since then (the new switch, the re-homed VLAN, the host that moved racks) is missing, and nothing on the diagram tells you which parts are still true.
- It shows one layer. Usually the one that was easiest to draw, so the question you actually have is on a layer the picture doesn't contain.
- Nobody trusts it mid-incident. Because of the first two, the diagram becomes a starting hypothesis you re-verify by hand against the live network, which is the work it was supposed to save you.
A map built from discovery inverts this. It is current because it rescans, it carries every layer because it was read from the network rather than drawn, and it earns the trust that lets you act on it instead of checking it first. That is the whole reason to prefer a live map over a static one: not that it looks better, but that you can use it when it counts.
Network mapping vs monitoring: different pictures
Mapping and monitoring get confused because both touch your devices, but they draw different pictures and answer different questions. They are not substitutes.
| Tool type | What it shows you | You reach for it when |
|---|---|---|
| Network mapping | The structure: what exists and how it connects | You need to see how the network fits together |
| Network monitoring | The state: device health, metrics, alerts | Something is down and you need to know first |
| Manual diagram tool | Whatever you draw on the canvas | You need a one-off picture for a slide |
Mapping shows you the shape of the network; monitoring tells you when part of that shape is on fire. Most teams need both, run alongside each other. A mapping tool that also tries to be your monitoring platform usually does neither part well. If your problem is less "I need to see how this connects" and more "we have no reliable record of what we have," that is the record-keeping angle, covered in the network documentation software guide.
Open-source network mapping tools
If you need to map a network that cannot phone home, or you want to avoid per-device licensing, the field narrows to a few self-hosted options. The question that separates them is whether they actually draw a map:
- Scanopy Community Edition is AGPL-3.0, an OSI-approved open-source license. It renders the interactive map with the four switchable views described above from a single scan, which is the main reason to reach for it over the single-view alternatives.
- NetDisco is a long-standing open-source tool for Layer 2 topology and switch-port maps, strong on wired discovery.
- NetBox is open source too (Apache-2.0), and its NetBox Discovery agent can scan a live network. But NetBox has no native map; it is a structured source of truth behind an API, and visualization comes from community plugins like netbox-topology-views. It is the data model, not the map. If you are weighing them directly, see our NetBox alternatives rundown.
How do you choose network mapping software?
- You want to see the network without drawing it: an automatic, discovery-based tool. That is the whole category.
- You need to read topology more than one way: a tool with switchable views, so physical, logical, workload, and application layers are separate maps rather than one tangle.
- You need it self-hosted or free to start: Scanopy Community or NetDisco.
- You only need one picture for a presentation: a manual tool like draw.io. Do not buy mapping software for a single drawing.
Scanopy maps the network and runs alongside monitoring
Scanopy is network mapping software, not a monitoring platform. A lightweight daemon discovers your hosts, services, interfaces, and topology, then builds an interactive map with four switchable views of the same scan: physical L2, logical L3, workloads, and applications. The map updates on a schedule. You can embed it in a wiki or intranet via iframe, share a read-only link that stays current as the network rescans, or export a snapshot as an image (PNG, SVG, PDF, HTML), as an editable draw.io or Visio diagram, as diagram markup (Mermaid, Confluence), or as CSV data. Pricing is flat regardless of host count, so mapping your whole network costs the same as mapping part of it, and it runs alongside whatever monitoring and asset tools you already have. If you outgrow the Community Edition, the commercial editions add team features and support without changing the pricing model.
Frequently Asked Questions
What is network mapping software?
Network mapping software discovers the devices on a network and the connections between them, then renders them as a topology map you can read. The automatic kind builds that map directly from the network using protocols like SNMP, LLDP, and ARP, and redraws it on a schedule, so it stays accurate instead of aging like a hand-drawn diagram.
What is the best free network mapping software?
For discovery-based mapping, the main self-hosted open-source options are Scanopy Community Edition (AGPL-3.0), which renders an interactive topology map with switchable views, and NetDisco, which is strong on Layer 2 switch-port maps. NetBox is open source too and can scan your network with its Discovery agent, though it has no native map and relies on community plugins for visualization.
How does automatic network mapping work?
A lightweight scanner queries the network over protocols the devices already implement. SNMP for device details and interfaces, LLDP and CDP for neighbor links, and ARP and MAC forwarding tables for host-to-switch connections. It stitches the results into a topology map and rescans on a schedule, so no one has to draw anything.
Can I map my network without installing agents?
Yes. Scanopy runs a single lightweight daemon on the network that queries devices over standard protocols. It does not install software on each host, so you map the network without an agent on every machine.
Why does one network need more than one map?
Physical cabling, IP routing, and application dependencies are different questions, and forcing them into one diagram produces a tangle no one can read. Mapping software that renders separate physical, logical, workload, and application views lets you look at the layer that answers the question in front of you instead of inferring it from a single picture.
Is network mapping the same as network monitoring?
No. Mapping software shows the structure of the network, what exists and how it connects; monitoring watches device health and alerts you when something breaks. They answer different questions and most teams run both. A mapping tool complements a monitoring platform, it does not replace it.
Started as a homelabber, now deep in SNMP MIBs, Layer 3 topology, and service fingerprinting - building the network documentation tool I wished existed.