TL;DR: You can map your whole network topology using nothing but snmpwalk and a terminal. This walks through every SNMP MIB that matters, what the OIDs mean, and how to correlate the data into a map. By the end you'll understand exactly what automated discovery tools do under the hood.
Ever wonder what network discovery tools actually do? They walk SNMP. That's most of it. They query a handful of standard MIBs, pull device identities, interface lists, and neighbor tables, then correlate the results into a graph.
You can do the same thing by hand. All you need is snmpwalk, a terminal, and managed gear that speaks SNMP. This article walks through every MIB that matters for topology, what each OID tells you, and how to stitch the data together into an actual map.
This is useful for more than curiosity. If you ever have to debug why a discovery tool is missing a device, or you want to understand what your tools are really querying, or you just want to map a small network without buying anything, the manual path teaches you the data model. Fair warning: by the end you'll also understand why people automate this. Most of the OIDs below are ones Scanopy queries on every scan. Doing it once by hand makes the case for itself.
The examples below all query the same device, at 192.168.7.230 with the community string netdefault. Swap in your own addresses and strings as you follow along.
Prerequisites
You'll need a few things before any of this works:
- net-snmp installed. This gives you
snmpget(one value) andsnmpwalk(a whole subtree). On Debian/Ubuntu:apt install snmp. On macOS:brew install net-snmp. - SNMP enabled on the devices you want to query. Managed switches, routers, firewalls, and most server OSes support it. Consumer gear (a typical home router or unmanaged switch) usually does not. If a device doesn't respond, that's often why.
- A community string. SNMPv2c uses a shared string as its only credential. The examples here use
netdefault;publicis the common factory default. On a real network you should set your own.
One security note before you start. SNMPv2c sends the community string in cleartext and offers no real authentication. It's fine on a trusted management network for read-only polling, which is all we're doing here. For anything touching untrusted segments, use SNMPv3, which adds authentication and encryption. The OIDs are identical either way. Only the transport and auth flags on the command change.
Step 1: Identify Your Devices (System MIB)
The first question any discovery process asks is "who is this device?" The System MIB (RFC 3418) answers it. Start with a single get:
$ snmpget -v2c -c netdefault 192.168.7.230 sysDescr.0
SNMPv2-MIB::sysDescr.0 = STRING: Cisco IOS Software, C2960 Software (C2960-LANBASEK9-M), Version 15.2(7)E3
sysDescr is a free-text description of the device: OS, model, version. It varies wildly by vendor, so you can't parse it reliably, but it's human-readable and tells you what you're looking at. The other System MIB OIDs round out the picture:
| OID | Name | What it tells you |
|---|---|---|
1.3.6.1.2.1.1.1.0 |
sysDescr | Full device description (OS, model, version). Free text. |
1.3.6.1.2.1.1.2.0 |
sysObjectID | Vendor identity. The number after 1.3.6.1.4.1.X is the Private Enterprise Number: 9 is Cisco, 8072 is net-snmp/Linux, 2636 is Juniper. |
1.3.6.1.2.1.1.3.0 |
sysUpTime | Uptime in hundredths of a second. Tells you if a device rebooted recently. |
1.3.6.1.2.1.1.5.0 |
sysName | Hostname, ideally the FQDN. Usually the most useful identifier. |
1.3.6.1.2.1.1.6.0 |
sysLocation | Physical location string. Often empty or vague, though a diligent admin fills it in. |
1.3.6.1.2.1.1.7.0 |
sysServices | Bitfield for the OSI layers the device operates at. Helps classify device type. |
$ snmpget -v2c -c netdefault 192.168.7.230 sysName.0 sysLocation.0 sysObjectID.0
SNMPv2-MIB::sysName.0 = STRING: switch-core-01
SNMPv2-MIB::sysLocation.0 = STRING: Server Room A, Rack 1
SNMPv2-MIB::sysObjectID.0 = OID: SNMPv2-SMI::enterprises.9.1.1208
sysObjectID is the one worth a second look. The Private Enterprise Number (PEN) embedded in it is a reliable vendor identifier, even when sysDescr is vague. Here it's enterprises.9.1.1208, and the 9 means Cisco, full stop, regardless of what the description string says. That's how discovery tools key off vendor without trying to regex the description text.
Now repeat that for every device on your network. Already tedious? We're just getting started.
Step 2: Enumerate Interfaces (Interface MIB)
The Interface MIB (RFC 2863) lists every interface on a device: physical ports, VLANs, tunnels, loopbacks. Walk ifDescr to see them all:
$ snmpwalk -v2c -c netdefault 192.168.7.230 ifDescr
IF-MIB::ifDescr.1 = STRING: GigabitEthernet0/1
IF-MIB::ifDescr.2 = STRING: GigabitEthernet0/2
IF-MIB::ifDescr.3 = STRING: GigabitEthernet0/3
IF-MIB::ifDescr.4 = STRING: Vlan10
That number after ifDescr is the ifIndex. It's the join key for everything that follows. Every per-interface table (speeds, MACs, status, IP assignments, neighbors) is indexed by ifIndex. Once you have it, you can line up the rest.
| OID | Name | What it tells you |
|---|---|---|
1.3.6.1.2.1.2.1.0 |
ifNumber | Total interface count. Sets expectations for the walk. |
1.3.6.1.2.1.2.2.1.1 |
ifIndex | Unique interface ID. The key that ties everything together. |
1.3.6.1.2.1.2.2.1.2 |
ifDescr | Interface description (e.g. "GigabitEthernet0/1"). |
1.3.6.1.2.1.2.2.1.3 |
ifType | IANA interface type. 6 is ethernet, 24 is loopback, 53 is propVirtual, 131 is tunnel, 135 is l2vlan, 161 is 802.11. |
1.3.6.1.2.1.2.2.1.5 |
ifSpeed | Speed in bits/sec. A 32-bit gauge, so it caps out around 4 Gbps and reports wrong for faster links. |
1.3.6.1.2.1.2.2.1.6 |
ifPhysAddress | The interface MAC. You'll need this later for correlation. |
1.3.6.1.2.1.2.2.1.7 |
ifAdminStatus | Desired state: up(1), down(2), testing(3). |
1.3.6.1.2.1.2.2.1.8 |
ifOperStatus | Actual state. Seven possible values, including dormant and lowerLayerDown. |
The ifSpeed cap is a real gotcha. On a 10G or 40G interface, the 32-bit gauge overflows and gives you garbage. The fix lives in the extended interface table (ifXTable):
| OID | Name | What it tells you |
|---|---|---|
1.3.6.1.2.1.31.1.1.1.1 |
ifName | Short interface name (e.g. "Gi0/1"). Often cleaner than ifDescr. |
1.3.6.1.2.1.31.1.1.1.15 |
ifHighSpeed | Speed in Mbps. Use this instead of ifSpeed for 10G and up. |
1.3.6.1.2.1.31.1.1.1.18 |
ifAlias | The description the admin typed into the interface config. |
ifAlias is gold when it's populated. It's whatever the admin wrote in the config (description Uplink to core), so it often tells you what a port is for in plain language:
$ snmpwalk -v2c -c netdefault 192.168.7.230 ifAlias
IF-MIB::ifAlias.1 = STRING: Uplink to switch-access-01
IF-MIB::ifAlias.2 = STRING: Uplink to router-gw-01
IF-MIB::ifAlias.3 = STRING: Server port
IF-MIB::ifAlias.4 = STRING: Management VLAN
That's the topology starting to leak out before you've even looked at a neighbor table. Port 1 goes to switch-access-01, port 2 to router-gw-01. Walk ifOperStatus and ifHighSpeed alongside this, line them up by ifIndex, and you have a real port inventory: name, purpose, speed, and whether it's actually up.
Step 3: Map IPs to Interfaces (IP Address Table)
Now connect interfaces to the IP addresses living on them. The IP Address Table (RFC 4293) does it:
$ snmpwalk -v2c -c netdefault 192.168.7.230 ipAdEntIfIndex
IP-MIB::ipAdEntIfIndex.127.0.0.1 = INTEGER: 1
IP-MIB::ipAdEntIfIndex.192.168.7.230 = INTEGER: 3
Look closely at the OID. The IP address is encoded into the OID suffix itself, one octet per component. ipAdEntIfIndex.192.168.7.230 means "the interface index for IP 192.168.7.230," and the value (3) is the ifIndex. So this device has 192.168.7.230 on interface 3, which from Step 2 is GigabitEthernet0/3.
| OID | Name | What it tells you |
|---|---|---|
1.3.6.1.2.1.4.20.1.1 |
ipAdEntAddr | IP address assigned to an interface. |
1.3.6.1.2.1.4.20.1.2 |
ipAdEntIfIndex | Which interface (ifIndex) the IP belongs to. |
1.3.6.1.2.1.4.20.1.3 |
ipAdEntNetMask | Subnet mask. Combine with the IP to get the network. |
Parsing IPs out of OID suffixes instead of values trips people up the first time. It's worth internalizing because LLDP and ARP do the same kind of suffix encoding, and you'll hit it again in the next two steps.
Step 4: Discover Neighbors (LLDP and CDP)
Everything so far describes a single device in isolation. This step is where topology comes from: finding out what's plugged into each port.
LLDP (Link Layer Discovery Protocol, IEEE 802.1AB) is the vendor-neutral way to do it. Devices advertise their identity out every port, and each device caches what it hears. Walk the remote table and you learn what's on the other end of each link:
$ snmpwalk -v2c -c netdefault 192.168.7.230 1.0.8802.1.1.2.1.4.1.1.9
iso.0.8802.1.1.2.1.4.1.1.9.0.1.1 = STRING: "switch-access-01"
Two things to notice. First, the OID prints numerically (iso.0.8802...) instead of with friendly names, because net-snmp doesn't ship the LLDP-MIB by default. The numbers are the same either way. Second, that trailing .0.1.1 is the index, and it matters.
| OID | Name | What it tells you |
|---|---|---|
1.0.8802.1.1.2.1.3.2.0 |
lldpLocChassisId | This device's chassis ID (usually its MAC). |
1.0.8802.1.1.2.1.3.3.0 |
lldpLocSysName | This device's system name. |
1.0.8802.1.1.2.1.4.1.1.5 |
lldpRemChassisId | Remote device's chassis ID. |
1.0.8802.1.1.2.1.4.1.1.7 |
lldpRemPortId | Remote port identifier. |
1.0.8802.1.1.2.1.4.1.1.8 |
lldpRemPortDesc | Remote port description. |
1.0.8802.1.1.2.1.4.1.1.9 |
lldpRemSysName | Remote device's hostname. This is what builds the topology. |
1.0.8802.1.1.2.1.4.1.1.10 |
lldpRemSysDesc | Remote device description. |
1.0.8802.1.1.2.1.4.2.1.2 |
lldpRemManAddr | Remote management IP. |
The LLDP remote table index is timeMark.localPortNum.remIndex, three numbers tacked onto the OID. In ...1.1.9.0.1.1 above, the 0 is timeMark, the 1 in the middle is the local port number, and the trailing 1 is the remote index. The middle number is the one you care about: it's how you tie a remote neighbor back to a local port. Scanopy pulls the value from position 1 of the suffix to match each neighbor to the right local interface. Parse the wrong position and your edges connect to the wrong ports.
So ...9.0.1.1 = switch-access-01 reads as: local port 1 on this device connects to switch-access-01. Pull the remote port too:
$ snmpwalk -v2c -c netdefault 192.168.7.230 1.0.8802.1.1.2.1.4.1.1.7
iso.0.8802.1.1.2.1.4.1.1.7.0.1.1 = STRING: "Gi0/1"
Cross-reference local port 1 against your ifName walk from Step 2 (it's Gi0/1) and you get the full edge: "Gi0/1 on switch-core-01 connects to Gi0/1 on switch-access-01."
If you're in a Cisco shop, CDP (Cisco Discovery Protocol) gives you the same kind of data, often with extra detail like the exact platform model. This lab is multi-vendor and the devices advertise over LLDP, so there's nothing to show from this host, but the walk looks like the LLDP one against the CDP cache:
| OID | Name | What it tells you |
|---|---|---|
1.3.6.1.4.1.9.9.23.1.2.1.1.4 |
cdpCacheAddress | Remote device's IP. |
1.3.6.1.4.1.9.9.23.1.2.1.1.6 |
cdpCacheDeviceId | Remote hostname. |
1.3.6.1.4.1.9.9.23.1.2.1.1.7 |
cdpCacheDevicePort | Remote port name. |
1.3.6.1.4.1.9.9.23.1.2.1.1.8 |
cdpCachePlatform | Device model/platform (e.g. "WS-C3750-48P"). |
The CDP index is simpler: cdpCacheIfIndex.cdpCacheDeviceIndex. The first number is the local ifIndex directly, so it maps straight back to your interface table from Step 2. No middle-position parsing needed.
Walk LLDP and CDP across your devices and you have edges. You now have the start of a topology graph.
Step 5: Find Everything Else (ARP Tables)
LLDP and CDP only see devices that speak those protocols, which in practice means switches, routers, and the occasional server. Printers, IoT gear, workstations, anything dumb or locked down, none of it advertises itself. To find those, walk the ARP table on a router or L3 switch:
$ snmpwalk -v2c -c netdefault 192.168.7.230 ipNetToMediaPhysAddress
IP-MIB::ipNetToMediaPhysAddress.3.192.168.7.234 = STRING: 2c:54:91:88:1a:b3
IP-MIB::ipNetToMediaPhysAddress.3.192.168.7.235 = STRING: 38:7c:76:05:b6:b6
Every entry is a device that has communicated through that router recently. The IP is encoded in the OID suffix again (after the leading ifIndex), and the value is the MAC. This is how you discover hosts that would otherwise be invisible to SNMP-based discovery, like the printer at .234 that never answers a neighbor query.
| OID | Name | What it tells you |
|---|---|---|
1.3.6.1.2.1.4.22.1.2 |
ipNetToMediaPhysAddress | MAC address for a given IP (the ARP cache). |
1.3.6.1.2.1.4.22.1.3 |
ipNetToMediaNetAddress | IP address for a given MAC. |
1.3.6.1.2.1.4.22.1.4 |
ipNetToMediaType | Entry type: static(4), dynamic(3). |
To place those devices on a physical port, you need one more table. On switches, the Bridge MIB (RFC 4188) records which MACs each port has seen:
| OID | Name | What it tells you |
|---|---|---|
1.3.6.1.2.1.17.4.3 |
dot1dTpFdbTable | MAC forwarding table (non-VLAN). |
1.3.6.1.2.1.17.7.1.2.2 |
dot1qTpFdbTable | VLAN-aware MAC forwarding table. |
Take a MAC from the ARP table, find which switch port saw it in the forwarding table, and you've mapped a silent device to a physical port. That's the same correlation a discovery tool runs to place an unmanaged printer in the right rack.
While you're enumerating hardware, the Entity MIB (RFC 4133) is worth a walk too. It reports the physical components inside a device, including serial numbers and model names that never show up in sysDescr:
| OID | Name | What it tells you |
|---|---|---|
1.3.6.1.2.1.47.1.1.1.1.5 |
entPhysicalClass | Component type: chassis(3), module(9), port(10). |
1.3.6.1.2.1.47.1.1.1.1.11 |
entPhysicalSerialNum | Serial number. |
1.3.6.1.2.1.47.1.1.1.1.12 |
entPhysicalMfgName | Manufacturer. |
1.3.6.1.2.1.47.1.1.1.1.13 |
entPhysicalModelName | Model name/number. |
Step 6: Putting It Together
Take stock of what you've collected:
- Device identities from the System MIB (Step 1)
- Interface inventories from the Interface MIB (Step 2)
- IP-to-interface mappings from the IP Address Table (Step 3)
- Neighbor relationships from LLDP and CDP (Step 4)
- ARP-discovered hosts and MAC-to-port mappings from ARP and the Bridge MIB (Step 5)
None of it is a topology yet. It's a pile of tables. The correlation step is the work:
- Match LLDP neighbor names to discovered devices.
lldpRemSysNamegives you a hostname; find that device in your Step 1 results and you've confirmed both ends of the link. - Tie neighbors to local ports. Use the local port number from the LLDP index (or the
ifIndexfrom the CDP index) to attach each edge to a specific interface from Step 2. - Match ARP MACs to switch ports. Cross-reference ARP MACs against the forwarding table to place silent devices.
- Draw the edges. Each confirmed connection becomes a line between two nodes.
The result is something like this, built entirely from the walks above:
switch-core-01 (192.168.7.230)
  Gi0/1 ── switch-access-01   (LLDP: local port 1)
  Gi0/2 ── router-gw-01       (Juniper MX204, LLDP: local port 2)
  Gi0/3 ── printer-lobby (192.168.7.234, via ARP + forwarding table)
If you followed along, congratulations. You just did manually what automated discovery tools do on every scan. You also see why network diagrams go stale so fast: this is an hour of work for a handful of devices, and it's a snapshot the moment you finish. Add a switch tomorrow and the map is wrong until someone re-walks everything. Static templates and spreadsheets have the same problem. They capture a moment, and the network moves on without them.
Or Just Automate It
Everything above is what Scanopy does under the hood, every time it runs a scan. Same MIBs, same OIDs, same correlation logic. It finds responsive hosts via ARP, then deep-scans each one as it answers, checking for SNMP on UDP 161 (and 1161) and walking the same MIBs you did by hand (System, Interface, IP, LLDP, CDP, ARP, Bridge) plus a few more like Entity and VLAN membership, then correlating the results into a graph.
Configuring it takes one input the tutorial didn't: your SNMP credentials, so the daemon can query your gear the same way snmpwalk -c netdefault just did. You set these up when you configure a daemon to install. A credential is either a community string (SNMPv1 and v2c) or a username with auth and privacy passphrases (SNMPv3), and you give it one of two scopes: a broadcast credential that's tried against every host during a scan, or a per-host credential pinned to specific IP addresses. When a scan runs, Scanopy attempts each credential as configured, and for every host where one succeeds, it persists that credential as the host's assigned credential and reuses it on later discovery runs. The first scan does the trial-and-error you'd otherwise do by hand with -c; every scan after that already knows which credential each device answers to. You can also create credentials outside the daemon setup at any time and assign them to hosts or set them network-wide.
The difference is scale and repetition. Scanopy does this across your entire network in minutes, repeats it on a schedule, and renders the result as an interactive map instead of an ASCII tree. Plenty of tools automate this SNMP walking, and we compared the best automated network diagram tools on discovery method, live updates, and pricing if you want to see how they stack up.
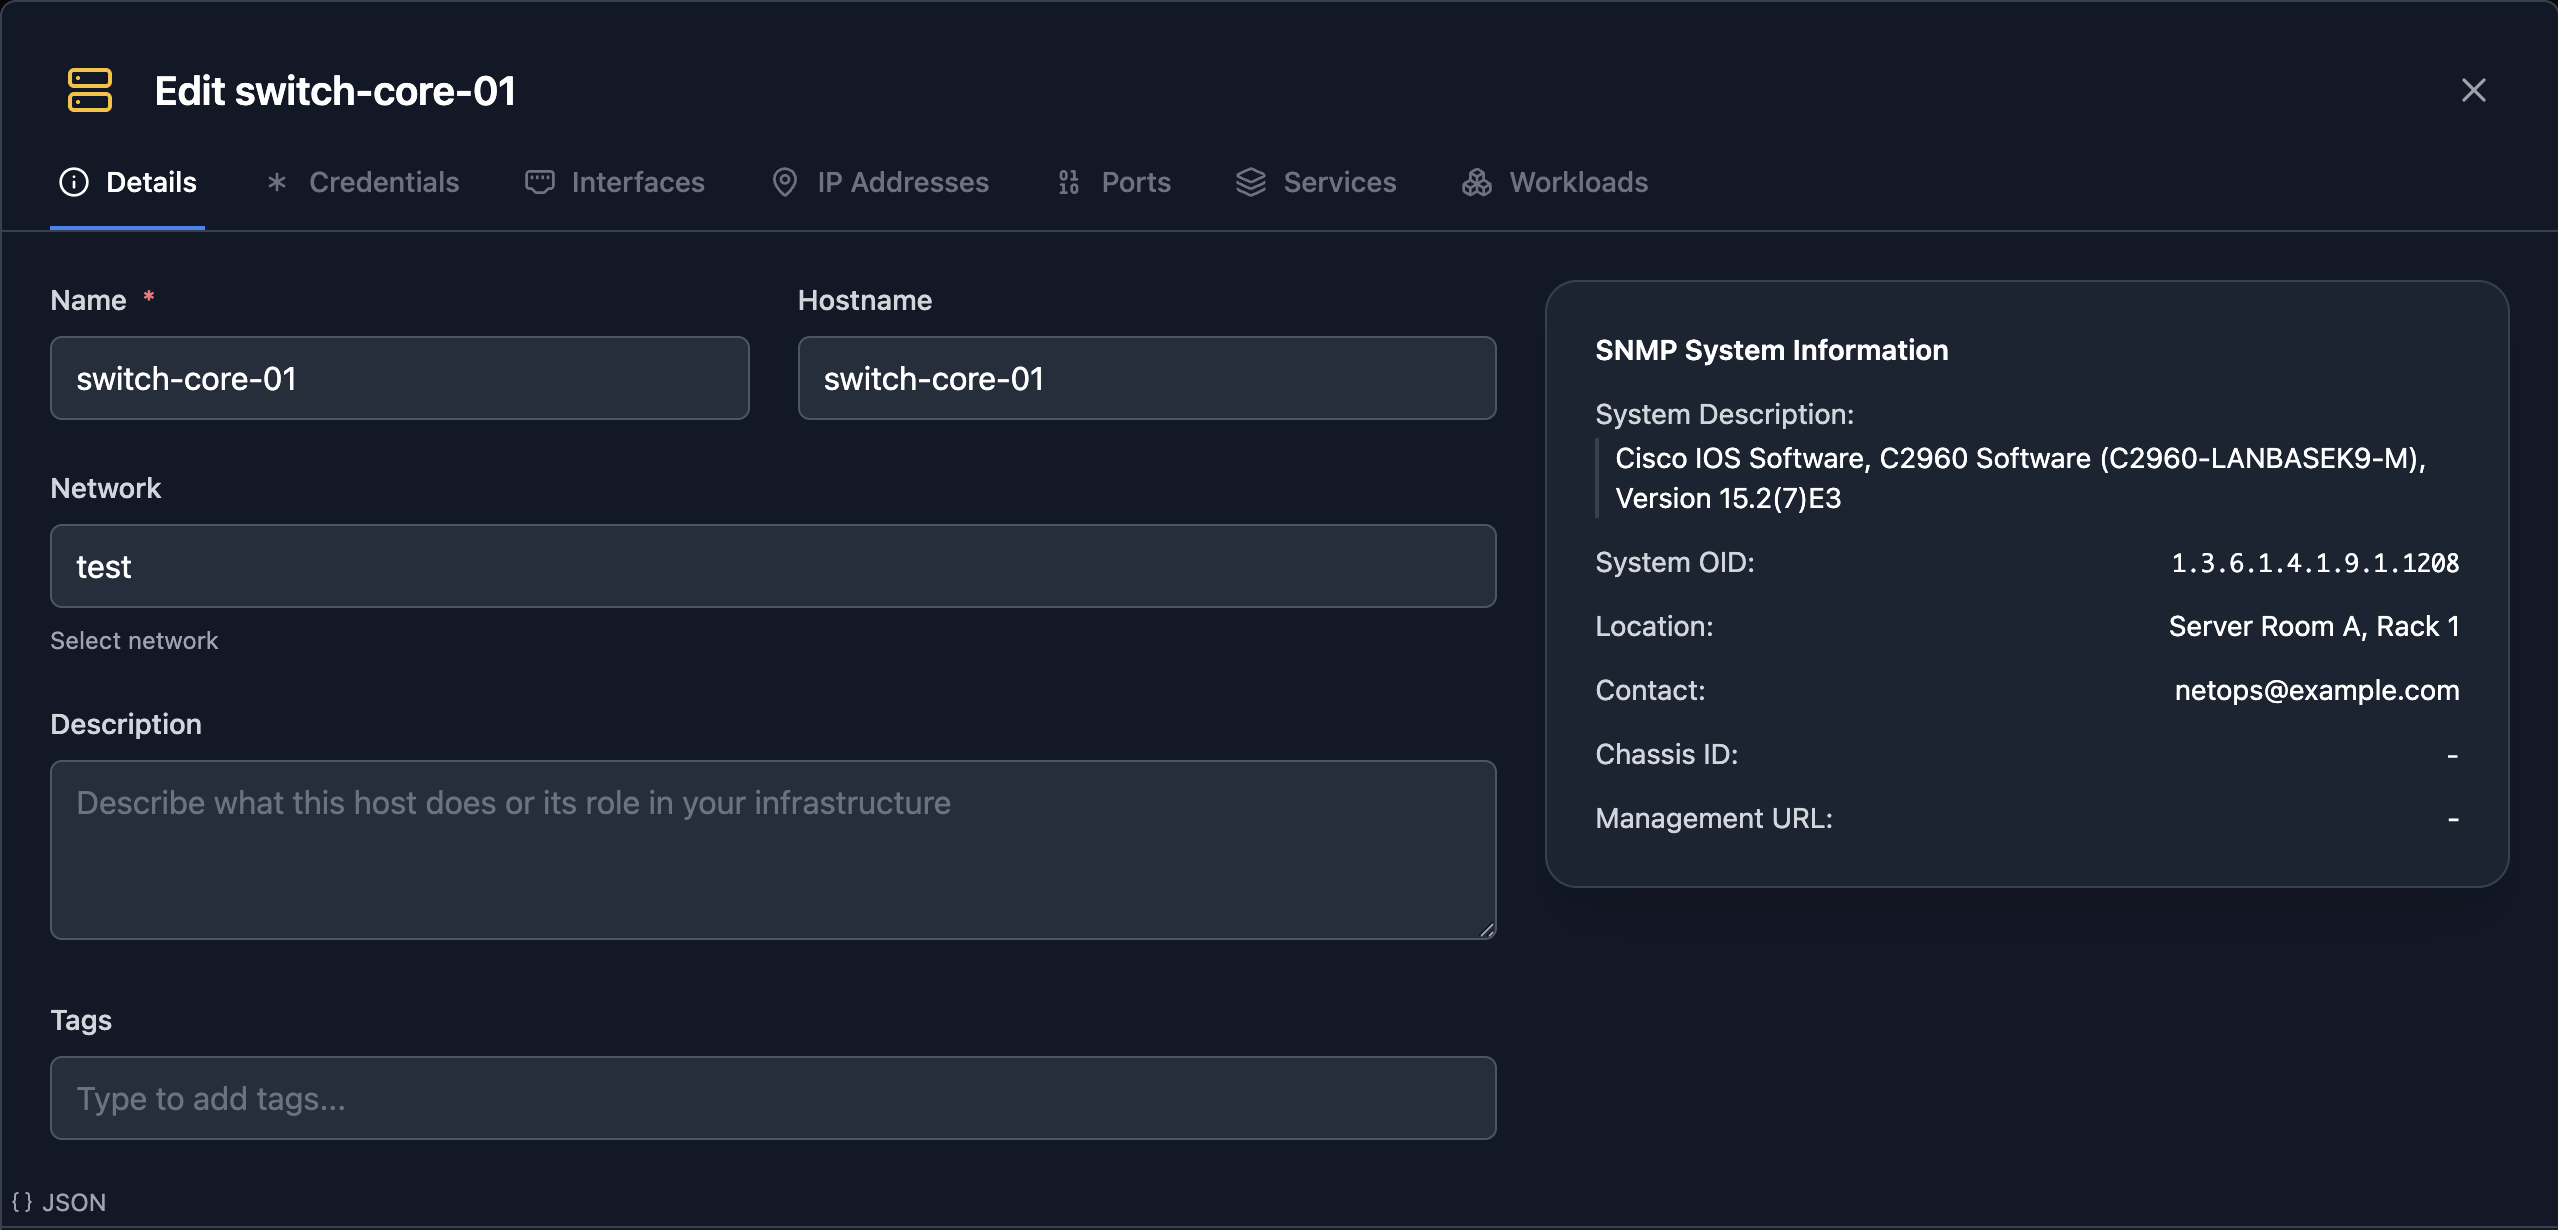
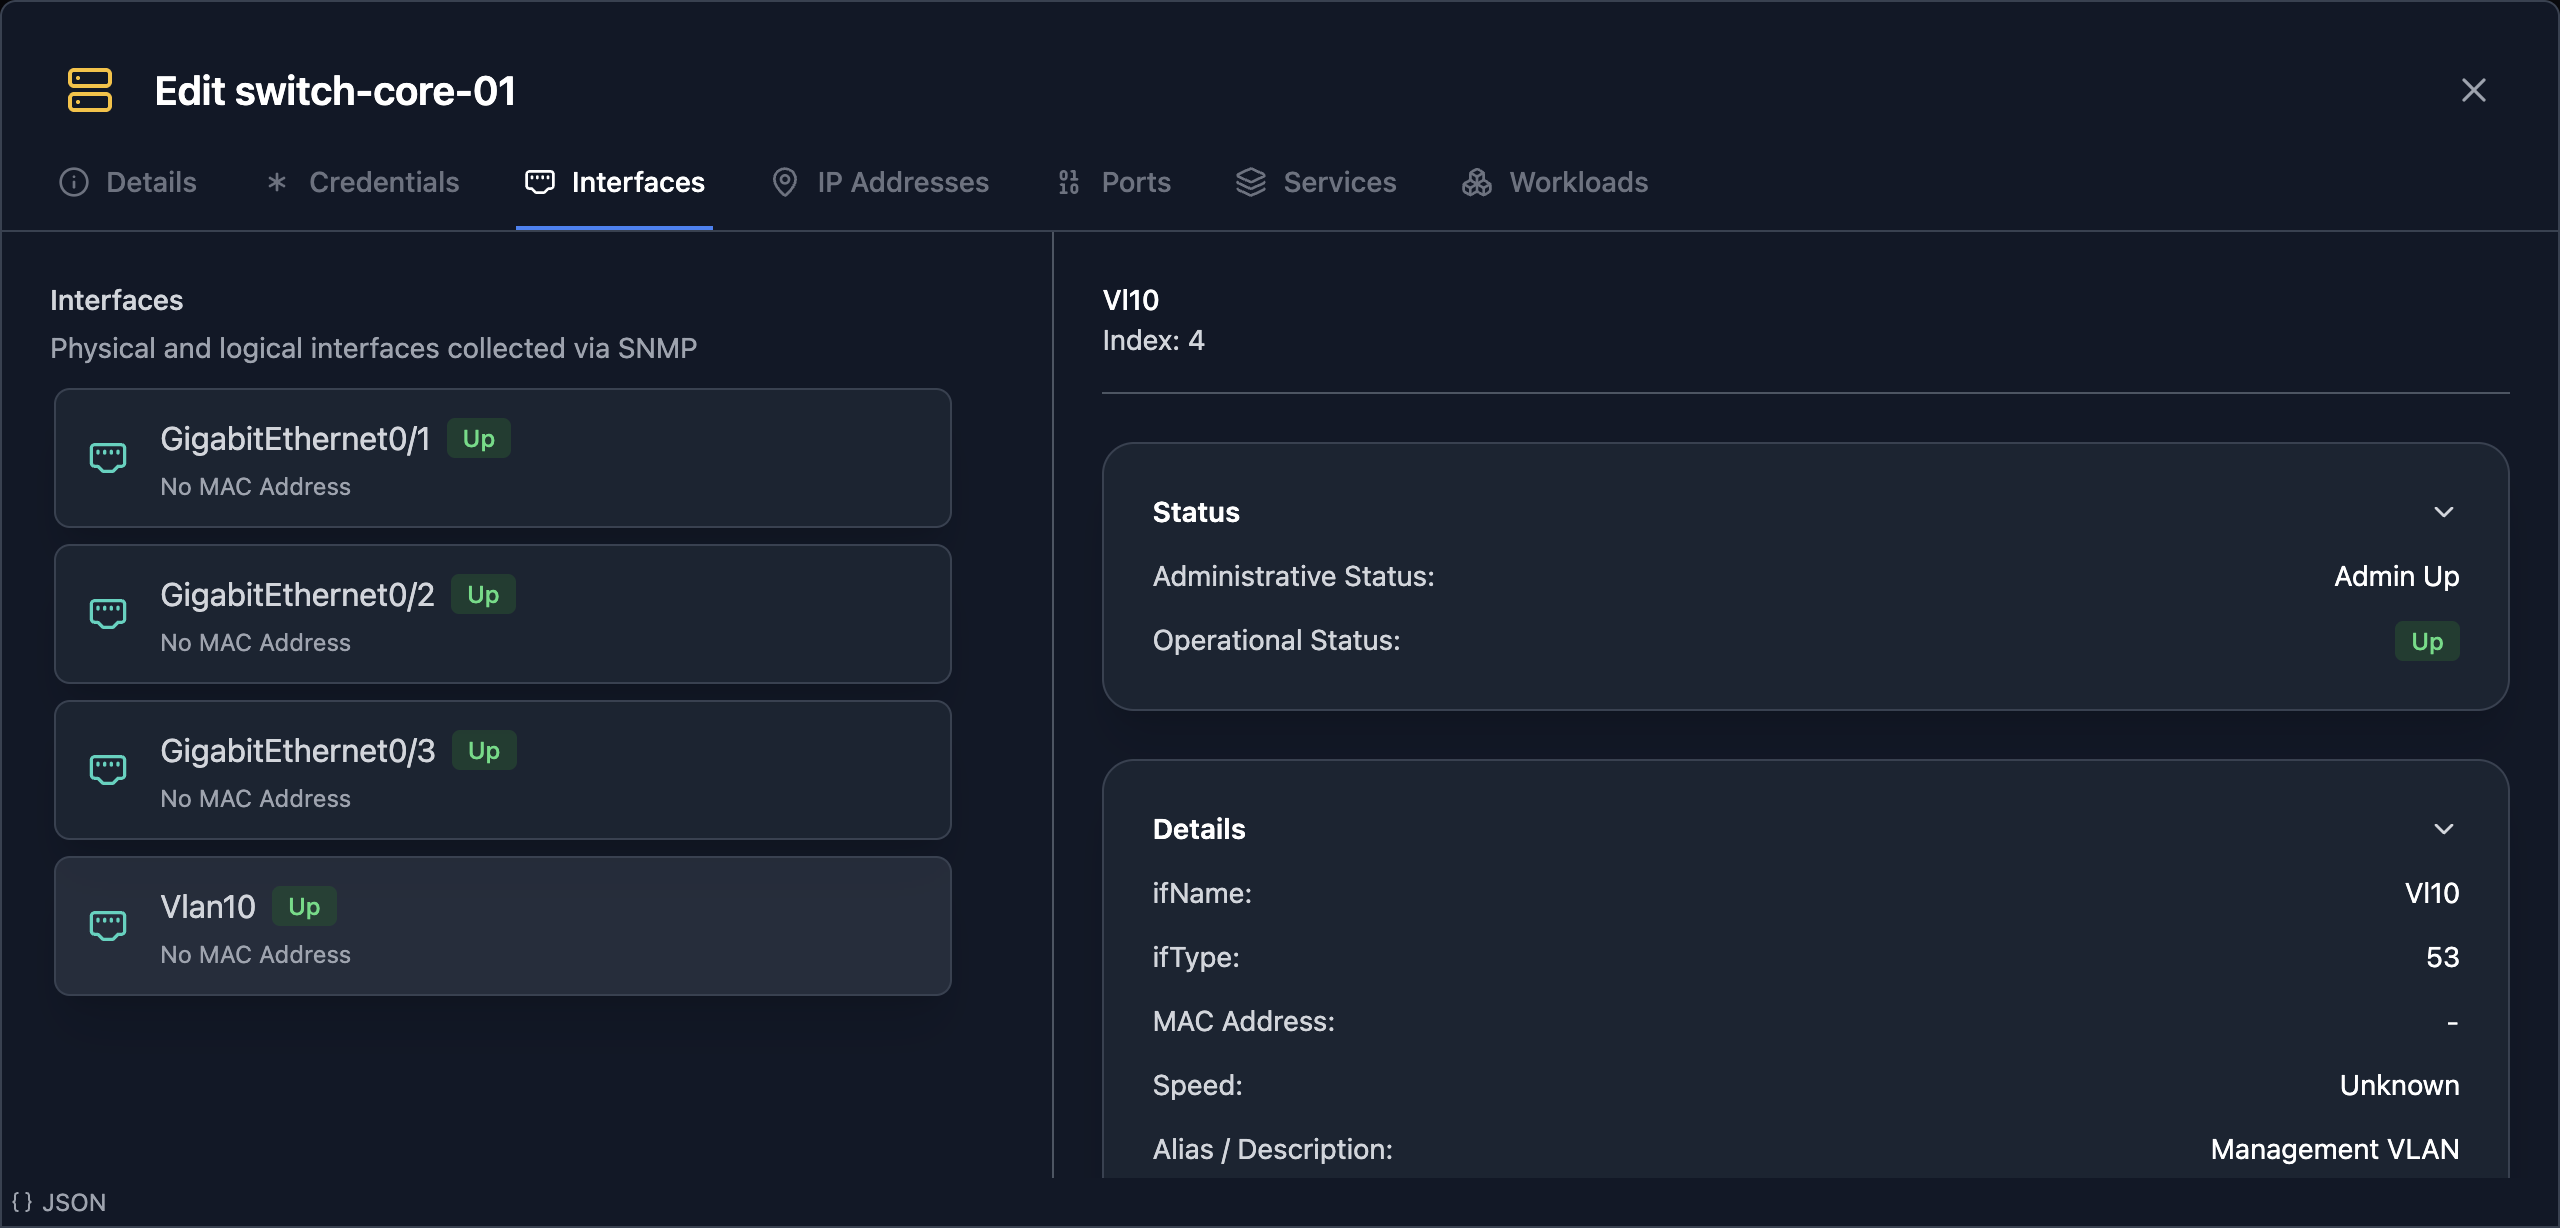
Start with a single device. Here is the same SNMP data you walked by hand, the system identity from Step 1 and the interface list from Step 2, pulled and structured automatically for switch-core-01:
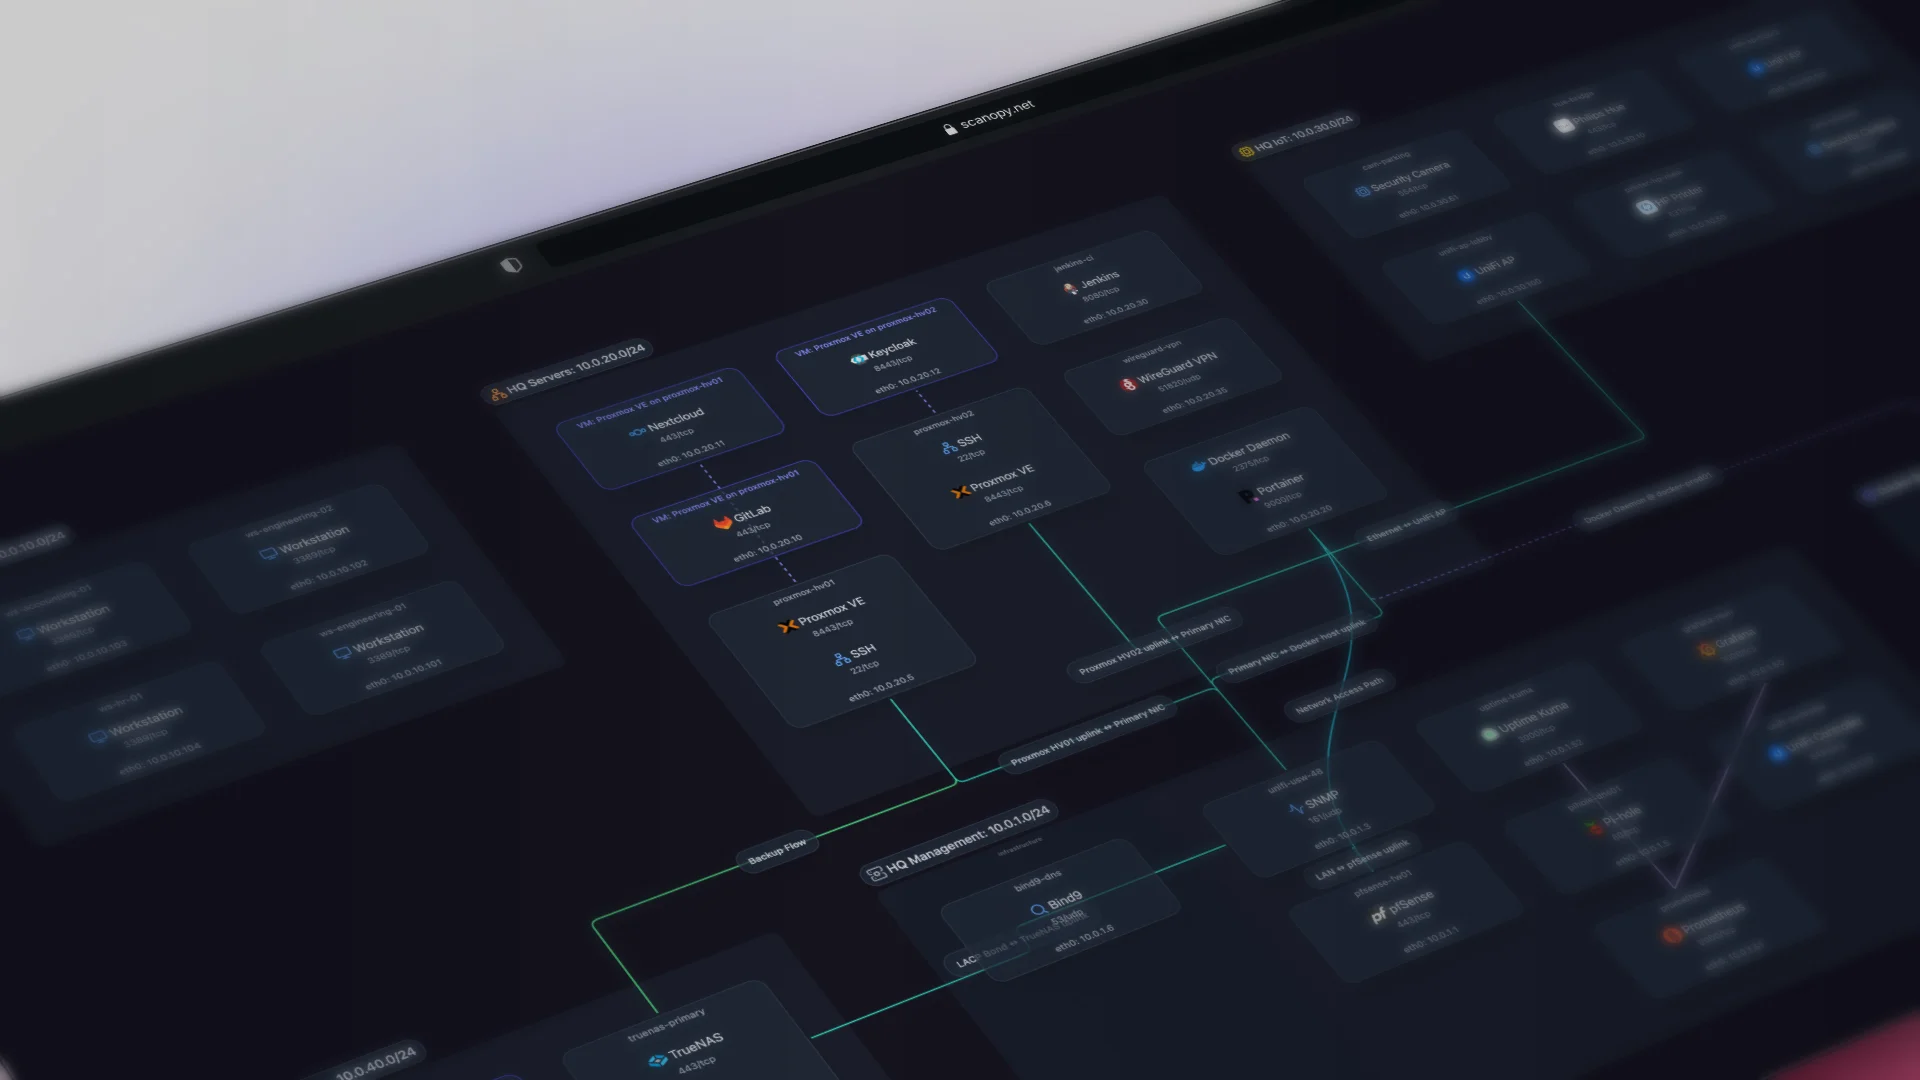
Now the part that took real work in Step 6, correlating neighbors into a topology, done for you across a whole network. This is an L2 (physical) view of a small datacenter:
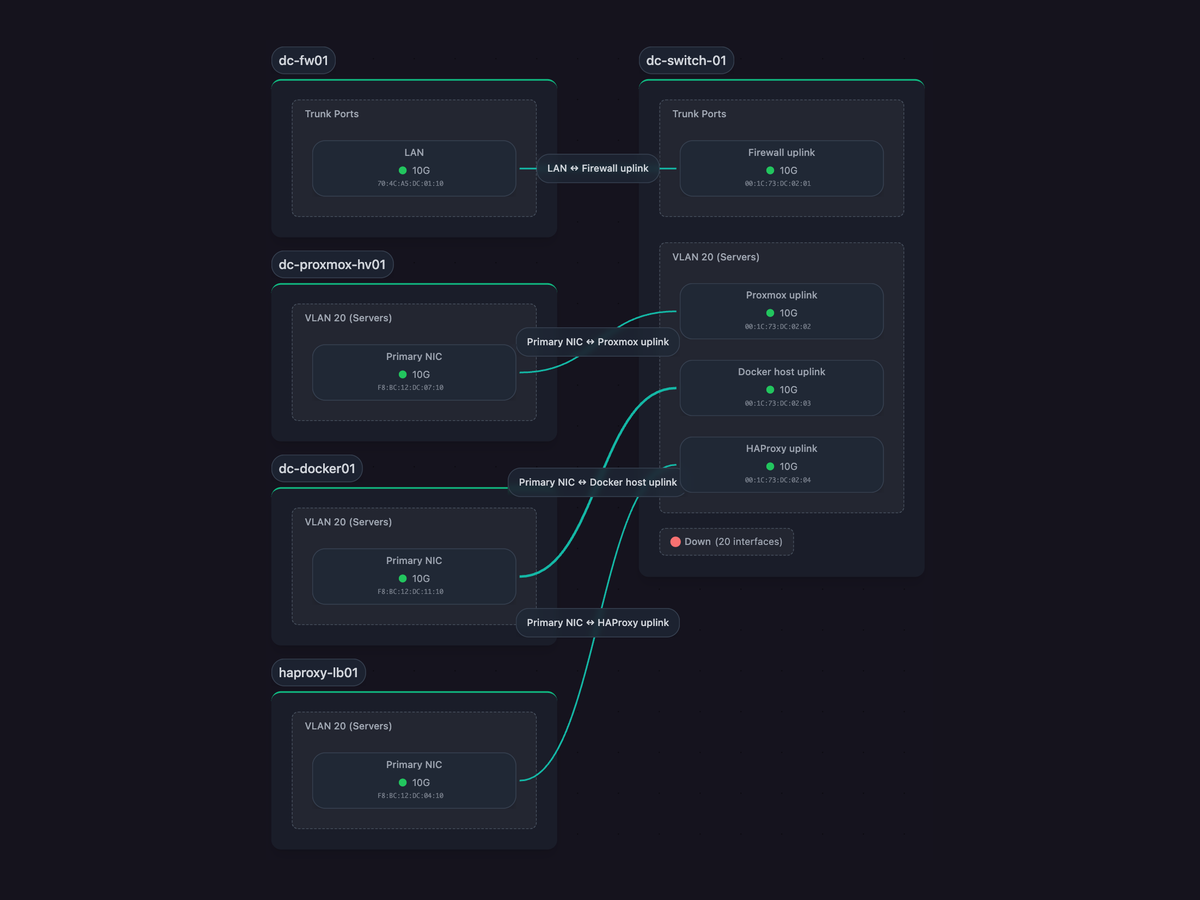
Everything on that map traces back to an OID you queried by hand. The port labels (Firewall uplink, Proxmox uplink, Docker host uplink) are ifAlias values from the Interface MIB. The 10G speeds come from ifHighSpeed, the MAC addresses from ifPhysAddress, and the lines between ports are LLDP neighbor data. The down ports are collapsed into a single group off ifOperStatus. Same data, same MIBs, correlated and drawn automatically, then re-walked on every scan so it never goes stale.
You can explore a live one yourself:
The SNMP data you just spent an hour querying by hand is always current, because the daemon re-walks it on every scan. Export the map to SVG, Mermaid, or Confluence markup, or embed it the same way the demo above is embedded, straight into your wiki, your runbook, or your Confluence page. It updates itself as the network changes. For the higher-level view of how automated discovery fits into documentation, see our companion piece on how automated network documentation actually works.
Try Scanopy
Scanopy queries every MIB in this article across your whole network in minutes, then keeps the map current on a schedule. Deploy a daemon and see it automated.
Started as a homelabber, now deep in SNMP MIBs, Layer 3 topology, and service fingerprinting - building the network documentation tool I wished existed.