Scanopy is for IT teams and MSPs who want a dedicated network diagram automation tool which works alongside their existing monitoring platform. ManageEngine OpManager is for mid-market IT teams that want monitoring and visualization at a lower per-device cost. The table below puts the two side by side on discovery, the four topology views, pricing, and licensing, so you can see where ManageEngine OpManager fits and where Scanopy does.
Scanopy vs ManageEngine OpManager: head to head
| Scanopy | ManageEngine OpManager | |
|---|---|---|
| DiscoveryProtocols used to find devices and map connections | SNMP LLDP CDP ARP TCP/UDP | SNMP CDP LLDP ARP [8] |
| Service detectionWhether the tool fingerprints services per host (databases, web servers, containers) beyond simple port detection | Yes 240+ types | No |
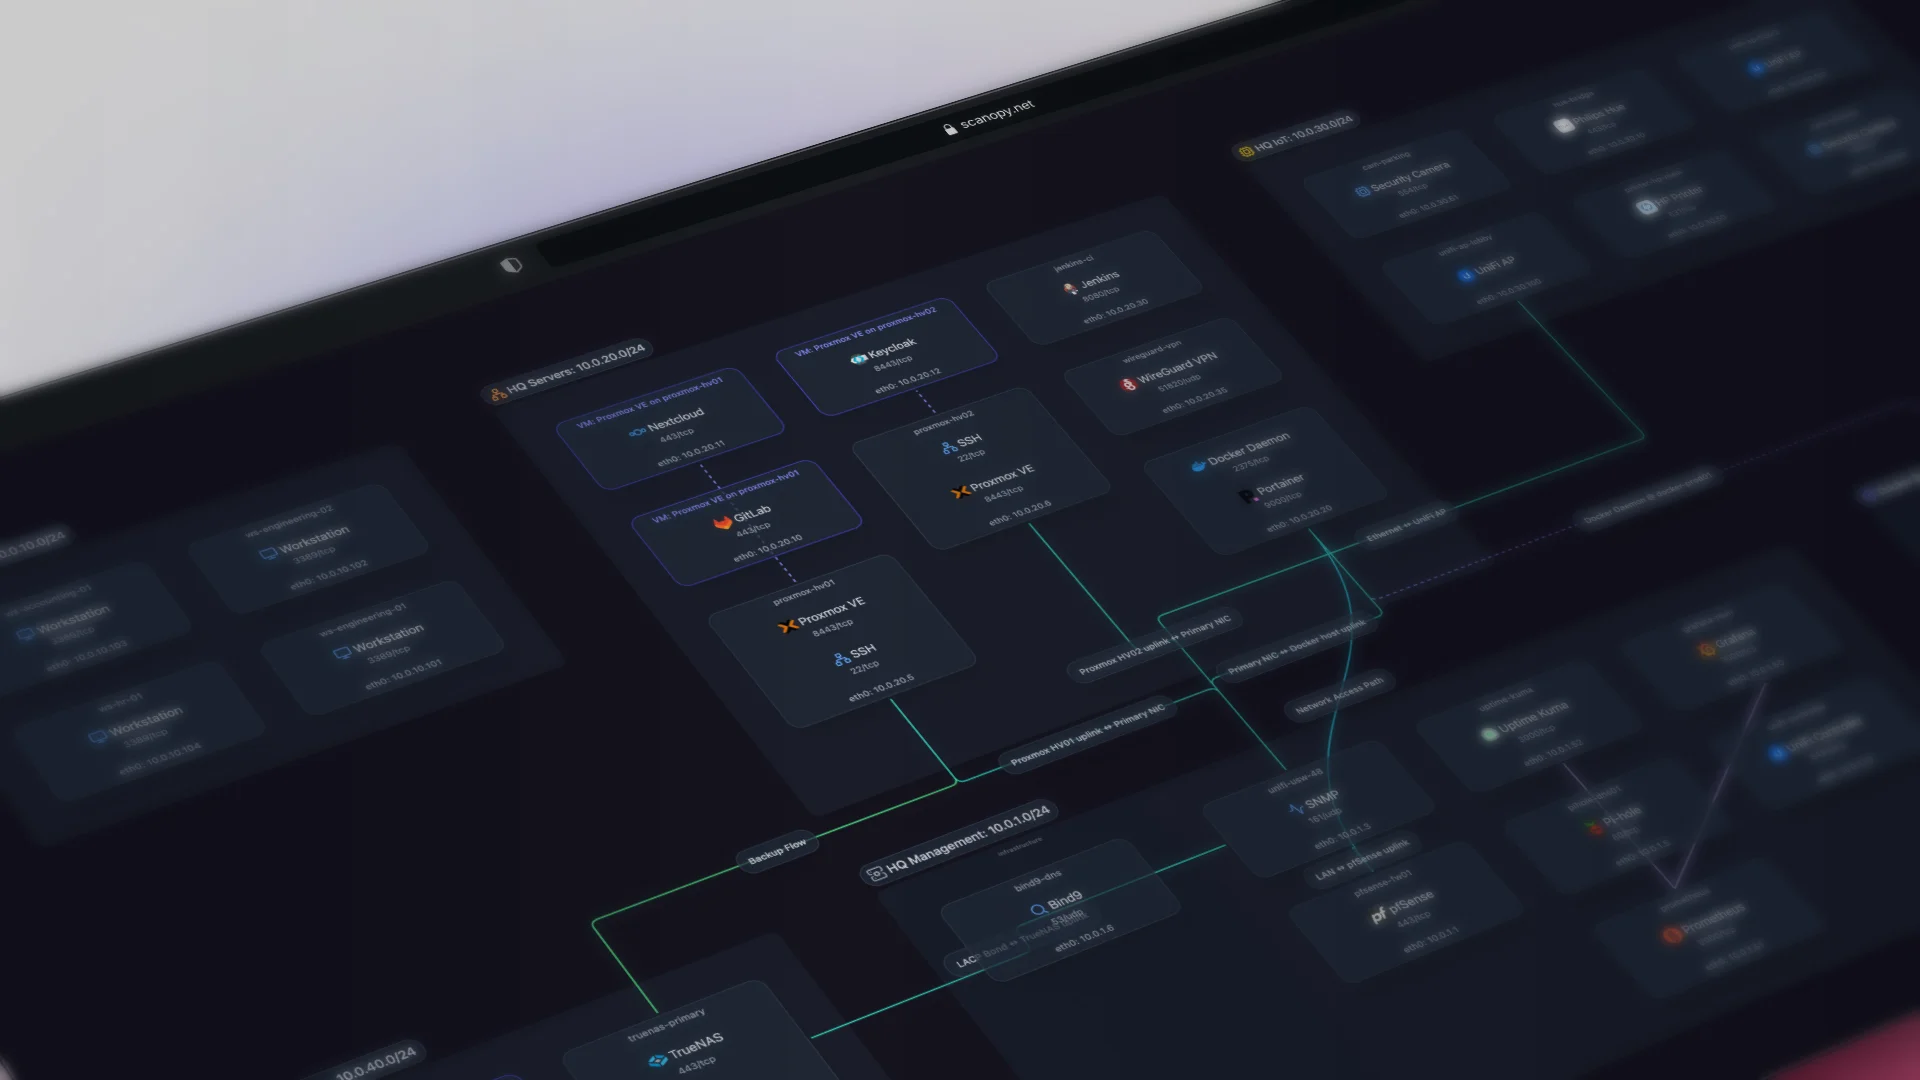
| Network ViewsWhich topology views the tool produces from discovery. L2 Physical switch ports and links L3 Subnets, VLANs, routing Workload VM/container host nesting Application Service-dependency / app grouping Yes supported Tag ? unverified Greyed not supported | ||
| Live updatesWhether the map updates automatically after the initial scan | Yes | Yes |
| Open sourceOSI means an OSI-approved open-source license; Source available means restricted; No means proprietary | OSI AGPL-3.0 | No |
| PricingStarting price or pricing model | Starts at $11.99 monthly, unlimited hosts | From $95/yr (10 devices) [9] |
| Also includesCapabilities beyond network diagramming | Docker Visualization | Monitoring |
When to choose which
Choose Scanopy when: You want a dedicated, living network-documentation tool: automatic L2, L3, workload, and application views, per-host service detection, flat pricing regardless of host count, and a free self-hostable Community edition. It sits alongside your monitoring stack rather than replacing it.
Choose ManageEngine OpManager when: Mid-market teams that want monitoring and visualization in one tool at a lower per-device cost than Auvik. The visualization options (rack views, floor plans) are unusually good for a monitoring tool.
This is a focused, two-tool comparison. For all 13 tools side by side, see the full comparison of automated network diagram tools.
Sources
Try Scanopy
Scanopy deploys a lightweight daemon that discovers your network and builds a live topology map. No per-device fees, unlimited hosts. It pairs with whatever monitoring tool you already use.
Started as a homelabber, now deep in SNMP MIBs, Layer 3 topology, and service fingerprinting - building the network documentation tool I wished existed.