TL;DR: "Most 'automated' network diagram tools are actually monitoring platforms that include mapping as a feature, or manual tools with no discovery at all. Here's what each tool actually does, what it costs, and which one fits your setup."
Dedicated Diagram Tools
| Tool | Discovery | ServicesNo No service awareness Basic Common port detection Yes Application-level fingerprinting | Auto-Updates | Open SourceOSI OSI-approved open source license Source available Source code available, restricted license No Proprietary | Pricing |
|---|---|---|---|---|---|
| Scanopy | SNMP LLDP CDP ARP TCP/UDP | Yes200+ types | Yes | OSIAGPL-3.0 | Flat monthly, unlimited hosts |
| SolarWinds NTM | SNMP WMI CDP ICMP VMware [3] | No | No | No | From $1,977/yr subscription [3] |
| NetBrain | SNMP CDP LLDP ARP SSH/CLI | No | Yes | No | Enterprise contact sales |
Monitoring Platforms with Diagrams
| Tool | Discovery | ServicesNo No service awareness Basic Common port detection Yes Application-level fingerprinting | Auto-Updates | Open SourceOSI OSI-approved open source license Source available Source code available, restricted license No Proprietary | Pricing | Also Includes |
|---|---|---|---|---|---|---|
| Auvik | SNMP CDP LLDP ARP [1] | Basic [2] | Yes | No | Per-device contact sales | Monitoring Traffic Analysis |
| PRTG | SNMP WMI Ping [4] | No | Yes | No | Free up to 100 sensors then tiered [4] | Monitoring Traffic Analysis |
| Domotz | SNMP ARP ICMP CDP LLDP [5] | Basic [6] | Yes | No | $1.50/device/mo [7] | Monitoring RMM |
| ManageEngine OpManager | SNMP CDP LLDP ARP [8] | No | Yes | No | From $95/yr 10 devices [9] | Monitoring |
Discovery Tools
| Tool | Discovery | ServicesNo No service awareness Basic Common port detection Yes Application-level fingerprinting | Auto-Updates | Open SourceOSI OSI-approved open source license Source available Source code available, restricted license No Proprietary | Pricing | Also Includes |
|---|---|---|---|---|---|---|
| Nmap + Zenmap | ICMP ARP TCP/UDP | Yes | No | Source available NPSL | Free | |
| LibreNMS | SNMP CDP LLDP [10] | No | No | OSI GPL-3.0 | Free | Monitoring |
Manual Diagramming
| Tool | Discovery | ServicesNo No service awareness Basic Common port detection Yes Application-level fingerprinting | Auto-Updates | Open SourceOSI OSI-approved open source license Source available Source code available, restricted license No Proprietary | Pricing |
|---|---|---|---|---|---|
| draw.io | No | No | No | OSI Apache-2.0 | Free |
| Lucidchart | Cloud import | No | No | No | From ~$9/user/mo [11] |
Full disclosure: Scanopy is our product. We built this list to be useful whether you pick us or not. Vendor details are based on publicly available documentation and pricing as of April 2026. Features, pricing, and capabilities may have changed since publication — check each vendor's website for the latest information.
What "Automated" Actually Means
"Automated network diagram tool" gets applied to three very different things:
Fully automated. Deploy a scanner or agent on your network. It discovers devices via SNMP, LLDP, CDP, or ARP. It maps connections. It produces a topology diagram. It rescans on a schedule and keeps the diagram current. You don't draw anything. (Here's a deeper look at how automated network documentation works.) Tools: Auvik, Scanopy, SolarWinds NTM, PRTG, Domotz, ManageEngine, LibreNMS. Nmap discovers hosts and services but doesn't produce persistent diagrams on its own.
Semi-automated. Import data from a cloud provider (AWS, Azure, GCP) or a CSV file. The tool generates a layout from that data. No on-prem network scanning. Tools: Lucidchart (cloud import), draw.io (with scripts).
Manual with templates. You place every icon, draw every connection. The tool gives you shape libraries and alignment guides. Tools: draw.io, Lucidchart, Visio.
Most "best network diagram tool" listicles mix all three categories together. This list separates them. If you want a diagram that stays current without you touching it, you need a tool from the first category.
Why Pricing Models Matter
Most teams need both monitoring and documentation. The question isn't whether to buy a monitoring tool. It's whether your documentation needs to be bundled into it.
Monitoring tools charge per-device or per-sensor because continuous state tracking (CPU, bandwidth, alerts) scales with device count. They often need an agent or sensor on (or pointed at) each device. That architecture and pricing model makes sense for monitoring. But documentation doesn't work the same way. A single daemon on your network can discover every device, map connections, and produce a topology diagram. One deployment covers the whole network. The per-device model doesn't apply.
Keeping documentation independent means you can switch monitoring tools without losing your network maps, and you're not paying per-device rates for diagrams.
Monitoring Platforms with Network Mapping
These are monitoring tools first, and strong ones. Network diagrams come included as part of the monitoring package. If you already use one of these for monitoring, the built-in mapping may be all you need. If you use a different monitoring stack, or want documentation that isn't tied to your monitoring vendor, a dedicated tool gives you more flexibility.
Auvik
Cloud-managed network monitoring built for MSPs. Auvik discovers devices via SNMP, CDP, LLDP, and ARP, then builds real-time topology maps that update continuously.
Discovery: SNMP, CDP, LLDP, ARP. NetFlow for traffic analysis. Cloud-hosted with an on-site collector agent.
Diagrams: Interactive topology maps, real-time updates, Layer 2/3 views. Clean UI. The mapping is genuinely good.
Pricing: Not published. Per-device pricing with multiple device categories charged at different rates. Requires a sales call.
Where it fits: If you're an MSP that needs monitoring, alerting, config backup, and network maps in one platform, Auvik is a strong option. The topology mapping is a real feature, not an afterthought.
Trade-off: Documentation is coupled to Auvik's per-device pricing and platform. If you already run a different monitoring stack (LibreNMS, Zabbix, PRTG), adding Auvik for diagrams means paying for monitoring capabilities you already have.
PRTG Network Monitor
Full monitoring stack from Paessler with auto-discovery and interactive maps. PRTG has been around since 2003 and has a large installed base.
Discovery: SNMP, WMI, Ping. NetFlow and packet sniffing for traffic analysis. Self-hosted on Windows.
Diagrams: 2D and 3D maps generated from discovery data. Functional, not the prettiest.
Pricing: Free up to 100 sensors (not 100 devices; a single device can use multiple sensors). Paid tiers scale by sensor count.
Where it fits: If you already use PRTG for monitoring and want basic topology visibility, the built-in maps avoid adding another tool. The maps show what PRTG discovers, which is thorough.
Trade-off: Mapping is secondary to monitoring. The diagram feature exists to visualize what PRTG monitors, not to produce shareable documentation.
ManageEngine OpManager
Network monitoring with Layer 2/3 auto-discovery and topology maps. Part of ManageEngine's larger IT management suite.
Discovery: SNMP, CDP, LLDP, ARP. Auto-maps port-level connectivity.
Diagrams: Topology maps, rack views, floor plan views. More visualization options than most monitoring tools.
Pricing: Standard edition starts at $95/year for 10 devices. Professional from $145/year. Scales by device count. Free edition available (3 devices).
Where it fits: Mid-market teams that want monitoring and visualization in one tool without Auvik's per-device pricing model. The visualization options (rack views, floor plans) are unusually good for a monitoring tool.
Domotz
Remote monitoring and management with network mapping. Popular with MSPs as a lower-cost Auvik alternative.
Discovery: SNMP, ARP, ICMP, CDP, LLDP, mDNS, NetBIOS. Cloud-hosted with an on-site agent.
Diagrams: Auto-generated topology maps. Functional. The focus is remote access and monitoring, with mapping as a supporting feature.
Pricing: $1.50/device/month. Free tier covers 1 managed device with unlimited discovery. Published and transparent.
Where it fits: MSPs who want monitoring, remote access, and basic network mapping at a fair price. Domotz is consistently cited as the most reasonably-priced monitoring platform in MSP communities.
Trade-off: Diagrams are secondary to remote access and monitoring. If documentation is your primary goal, the mapping features may not go deep enough.
Dedicated Network Mapping Tools
These exist specifically to discover and map networks. Not monitoring platforms. No alerting, no traffic analysis, no config backup. Their entire purpose is producing accurate network diagrams.
SolarWinds Network Topology Mapper
The most widely-recommended automated network diagram tool. NTM scans your network and generates topology diagrams exportable to Visio, PDF, and PNG.
Discovery: SNMP, ICMP, WMI, CDP, VMware. Scan-on-demand (not continuous). Supports scheduled scans.
Diagrams: Multiple diagram types from a single scan (Layer 2, Layer 3, physical). Exports to Visio format. Auto-layout with manual override.
Pricing: Subscription starting at $1,977/year. Perpetual license options also available.
Where it fits: Enterprise teams that need compliance-ready documentation with Visio exports. The Visio export alone makes it the default choice in organizations that standardize on Microsoft tools.
Trade-offs: Requires Windows. Scan-on-demand means diagrams are snapshots, not living documents (though scheduled scans help). The interface feels dated compared to modern web apps. The SolarWinds brand carries baggage from the 2020 supply chain incident, though NTM is a separate, much simpler product.
Scanopy
Full disclosure: Scanopy is our product. We've tried to be honest about every tool on this list, including our own.
Scanopy is an automated network documentation tool. It deploys a lightweight daemon that discovers your network and builds an interactive topology map that updates on a schedule.
Discovery: One daemon per network discovers everything via SNMP, LLDP, CDP, ARP tables, and MAC forwarding tables. No agents on endpoints, no SSH credentials. Also pulls data from vendor APIs for richer device context beyond what protocol scanning alone provides.
Service discovery: This is where Scanopy differs from most tools on this list. Beyond mapping devices and connections, Scanopy fingerprints 200+ service types per host: databases, web servers, DNS, DHCP, Docker containers, print services, and more. Most network mapping tools tell you a device exists at an IP address. Scanopy tells you what it's running. When you click a host on the topology map, you see every detected service, not just the host itself.
Diagrams: Interactive topology map showing devices, connections, services, and interfaces. Shareable via link (no per-seat licensing). Exportable as SVG, Mermaid, and Confluence markup. Embeddable via iframe.
Pricing: Flat monthly pricing, unlimited hosts. No per-device fees. Free self-hosted Community edition available.
Where it fits: Teams that need network documentation without deploying a monitoring platform. Homelabs, small IT teams, MSPs documenting client networks. Pairs well with whatever monitoring tool you already use.
What Scanopy doesn't do: Monitoring, alerting, traffic analysis, config backup, patch management, software license tracking. It's a documentation tool. If you need monitoring, use a monitoring tool alongside it.
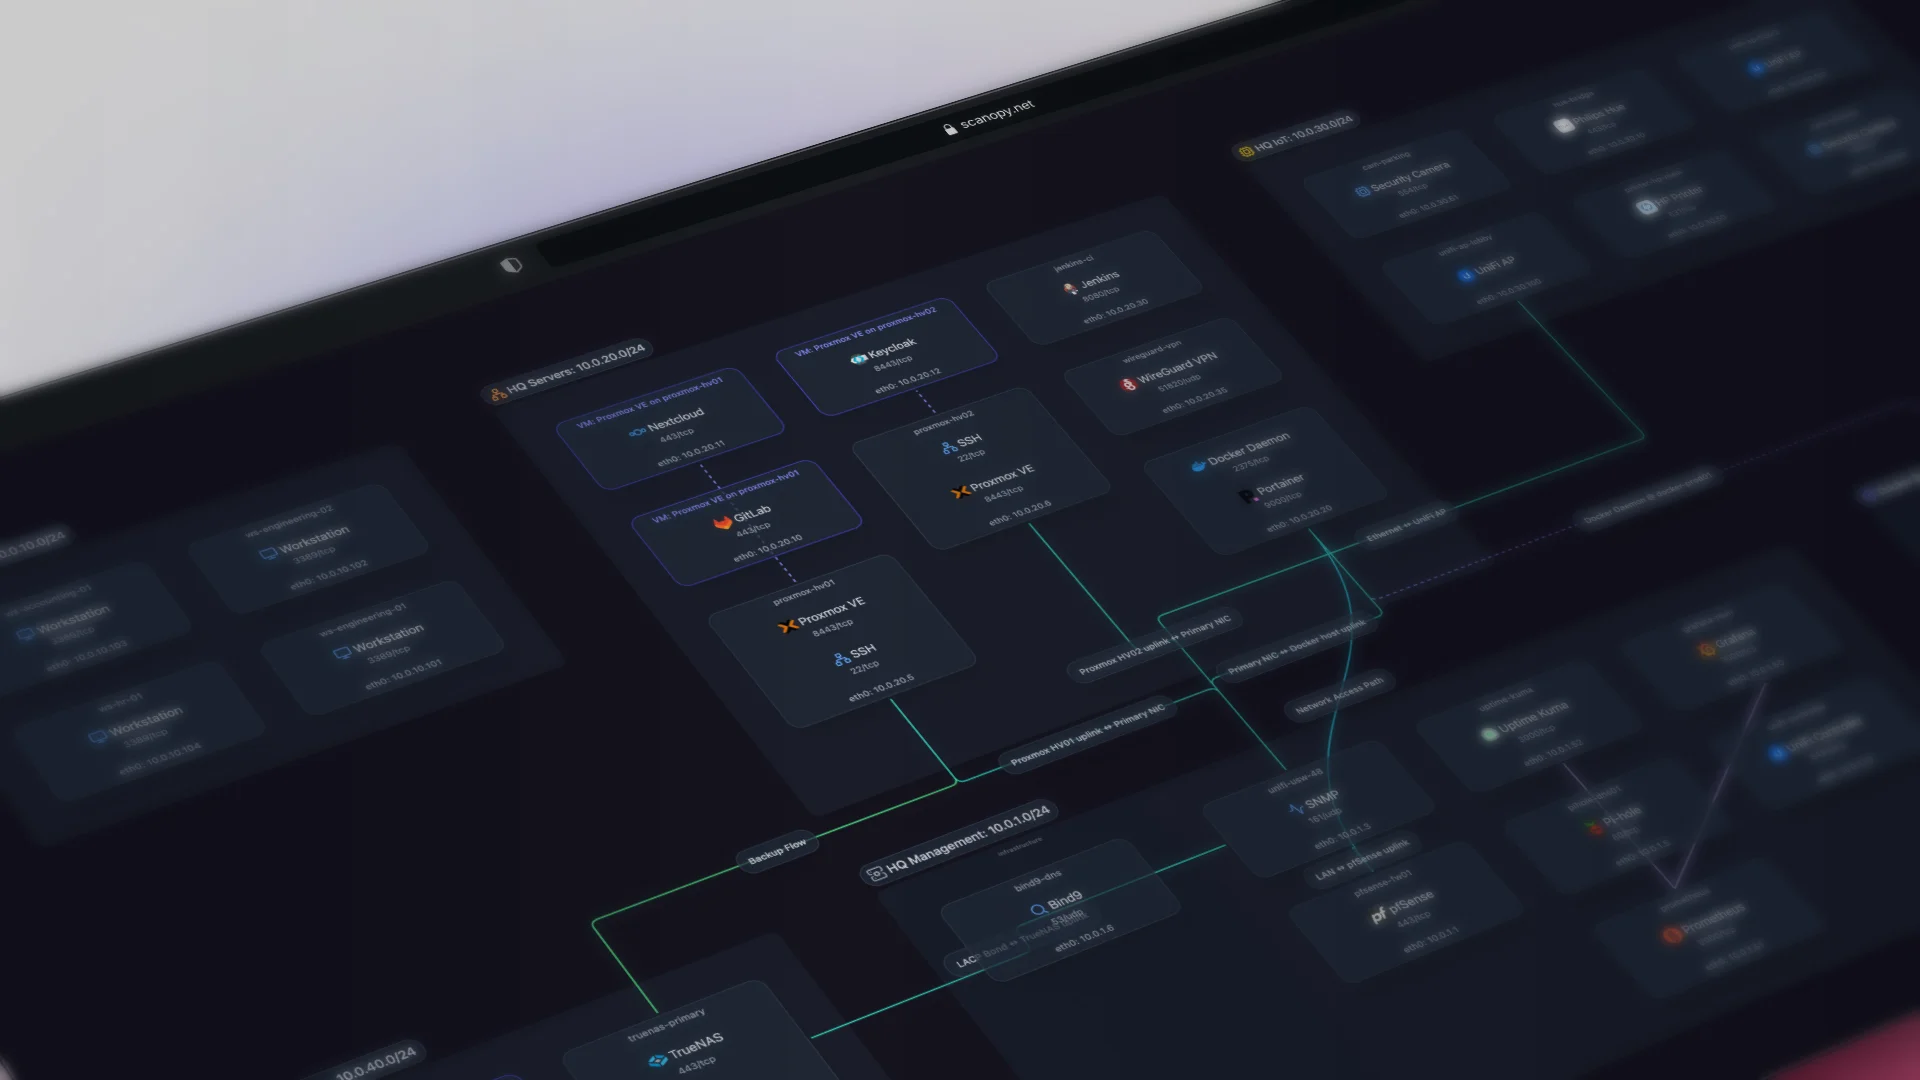
This is a live Scanopy map you can interact with. Click a host to see its services and interfaces.
NetBrain
Enterprise-grade dynamic network mapping with automation and troubleshooting workflows. NetBrain maps sit at the center of a broader automation platform.
Discovery: Multi-protocol enterprise discovery. Deep integration with network automation workflows.
Diagrams: Dynamic maps that tie into troubleshooting runbooks and automation playbooks. Maps can trigger actions, not just display data.
Pricing: Enterprise pricing (contact sales). Not published.
Where it fits: Large, complex networks where diagrams aren't just documentation but part of the operational workflow. NetBrain is genuinely powerful for this use case.
Trade-off: Overkill for anything smaller than a large enterprise. The pricing and complexity reflect that.
Manual Diagramming Tools
These tools don't discover your network. You draw the diagram yourself. They show up in "automated network diagram" recommendations constantly, so they're worth covering to clarify what they actually do.
draw.io (diagrams.net)
Free, open-source diagramming tool with extensive network shape libraries. The most popular free alternative to Visio.
Discovery: None. You place shapes and draw connections manually. You can import from CSV or XML if you build the data pipeline yourself.
Diagrams: Highly customizable. Huge icon libraries (Cisco, AWS, Azure, generic network). Export to everything. Works offline.
Pricing: Free.
Where it fits: One-time diagrams, architecture documentation, presentations. If you need a diagram for a specific project or meeting and you're willing to draw it, draw.io is excellent.
The catch: The diagram is a snapshot of the moment you drew it. It won't update when your network changes. If you're looking for automated, continuously updated diagrams, draw.io isn't that. But for a well-crafted, specific-purpose diagram, nothing beats the flexibility of drawing it yourself.
Lucidchart
Collaborative cloud-based diagramming with real-time multi-user editing. Imports infrastructure data from AWS, Azure, and GCP.
Discovery: Cloud infrastructure import (AWS, Azure, GCP). No on-prem network scanning.
Diagrams: Professional-grade output. Real-time collaboration. Extensive template library. Integrates with Google Workspace, Atlassian, Microsoft.
Pricing: Free tier available. Individual plans from ~$9/user/month (billed annually). Team plans from ~$10/user/month.
Where it fits: Teams that need polished, shareable diagrams for documentation, presentations, or cloud architecture reviews. The collaboration features are genuinely best-in-class.
The catch: Same as draw.io for on-prem networks: you're drawing the diagram, not discovering it. The cloud import feature is useful for AWS/Azure/GCP environments but doesn't help with physical networks, switches, or on-prem infrastructure.
Open Source Options
LibreNMS
Open-source network monitoring with auto-discovery and a weathermap plugin for topology visualization. PHP-based. Active community.
Discovery: SNMP, CDP, LLDP auto-discovery.
Diagrams: The Network Weathermap plugin generates topology visualizations. Not a core feature; requires separate setup. New devices are not automatically added to the map — topology layout is manual.
Pricing: Free.
Where it fits: Teams with Linux server management skills that want free monitoring with some topology visualization. If you're already running LibreNMS for monitoring, the weathermap plugin adds basic mapping without another tool.
Trade-off: Topology visualization is a community plugin, not a first-class feature. Setup requires Linux, PHP, and database administration. The monitoring side is strong; the diagramming side is minimal.
Nmap + Zenmap
Nmap is the standard open-source network scanner. Zenmap is its official GUI, which includes basic topology visualization of scan results.
Discovery: Host discovery (ping, ARP, TCP/UDP), port scanning, service fingerprinting, OS detection. Nmap's service detection is thorough: it doesn't just find open ports, it identifies what's running on them.
Diagrams: Zenmap generates a simple topology view from scan results. Functional for visualizing a single scan, but not a full network diagram tool. For more polished output, export Nmap data (XML) to Graphviz, D3.js, or import into draw.io.
Pricing: Free (open source).
Where it fits: Security audits, one-off network discovery, and as the discovery layer in custom automation pipelines. If you want to know what's on your network right now and what services are running, Nmap is the fastest path. Pair it with a rendering tool for diagrams.
Trade-off: No continuous updates, no topology mapping (LLDP/CDP), no persistent documentation. Each scan is a snapshot. Zenmap's visualization is minimal. For ongoing, automated diagrams, Nmap is the discovery step, not the whole solution.
Scanopy Community Edition
Scanopy's free, self-hosted edition. Same discovery engine as the paid product — SNMP, LLDP, CDP, ARP — with an interactive topology map and service detection. Open source and runs on your own hardware.
Discovery: Same multi-protocol discovery as the hosted version. One daemon, no per-device agents.
Diagrams: Interactive topology map with service and interface detail. Exportable as SVG, Mermaid, and Confluence markup.
Pricing: Free. Self-hosted.
Where it fits: Homelabbers and small teams that want automated network documentation without a SaaS dependency. If you're already self-hosting your infrastructure, this fits right in.
Trade-off: Self-hosted means you manage updates and the host it runs on. No cloud dashboard or team sharing features from the paid tiers.
Honorable mentions
Graphviz / D3.js. Rendering engines, not discovery tools. If you've already got network data from another source (Nmap scans, SNMP polls, API calls), Graphviz and D3 can turn it into a diagram. This is the DIY path. Extremely flexible, significant engineering effort required.
How to Choose
Want diagrams bundled with monitoring? If you already use Auvik, PRTG, Domotz, or ManageEngine for monitoring, use their built-in mapping. No reason to add another tool for something your monitoring platform already does.
Want documentation independent from your monitoring stack? Scanopy or SolarWinds NTM. Scanopy gives you a living map that updates on a schedule with flat pricing. SolarWinds NTM gives you scan-on-demand with Visio exports. Different approaches to the same goal.
Managing a large enterprise with automation needs? NetBrain. Nothing else on this list operates at the same scale with the same automation integration.
Need a one-time diagram for a presentation or project? draw.io or Lucidchart. Draw it once, export it, done. No ongoing cost, no infrastructure. draw.io is free. Lucidchart is better for team collaboration.
Want free and self-hosted? LibreNMS for monitoring with basic maps. Scanopy Community Edition for documentation-focused mapping. draw.io for manual diagrams. All three are free.
MSP managing multiple client networks? Auvik if you want monitoring bundled in (per-device pricing scales with your client base). Scanopy if you want documentation decoupled from monitoring (flat pricing regardless of host count).
Try It
Scanopy deploys a lightweight daemon that discovers your network and builds a live topology map. No per-device fees, unlimited hosts. It pairs with whatever monitoring tool you already use.
Try Scanopy free, view pricing, or read the docs to get started.
Sources
[1] Auvik — How does Auvik discover network topology and device information?
[2] Auvik — Can Auvik discover services on my network?
[3] SolarWinds — Network Topology Mapper
[4] Paessler — PRTG Pricing
[5] Domotz — Agentless Network Discovery for MSP Client Onboarding
[6] Domotz — Device TCP/UDP Ports/Services Discovery
[7] Domotz — Pricing
[8] ManageEngine — Discover Networks
[9] ManageEngine — OpManager Editions
[10] LibreNMS — Auto-Discovery
[11] Lucidchart — Pricing
Get notified when we publish new posts
Network documentation tips, product updates, and the occasional deep dive.

Founder of Scanopy. Self-hoster, homelabber, and the person behind Scanopy's automatic network documentation.